All published articles of this journal are available on ScienceDirect.

Physico-chemical Analysis, Microbial Isolation, Sensitivity Test of the Isolates and Solar Disinfection of Water Running in Community Taps and River Kandutura in Nakuru North Sub-county, Kenya
Abstract
Nakuru North sub-county is a peri-urban area which has both dry and wet seasons. Its residents rely mostly on untreated water sources for daily water needs due to unreliable water supply from the urban council. However, this water has not been evaluated on its quality despite residents solely depending on it. This study was aimed at determining the physico-chemical and bacteriological quality of water drawn from River Kandutura and water taps in Nakuru North sub-county. In addition, the study was aimed at carrying out sensitivity test of the isolates to antibiotics and determining effectiveness of solar disinfection in water treatment. A total of 510 water samples; river (255) and taps (255) were collected and analyzed between January and December 2013. Antimicrobial sensitivity test was carried out using Kirby Bauer disk diffusion test. Out of five hundred and ten (510) samples examined for microorganisms, 36.86 % (188/510) were positive for E. coli, Shigella and Salmonella. Water used by Nakuru North sub-county residents is highly contaminated thus posing public health risk. Solar disinfection experiment indicated a possibility of effective decontamination of water up on exposure to sun light for 3-5 h. E. coli showed the highest resistance (26.3 %) followed by Salmonella (17.4 %) while Shigella showed the least (17.1 %). However, there was no significant deference (p=0.98) in resistance among total coliforms, Total heterotrophic and Salmonella at 0.05 level of significant. There is a need to enforce laws and policies on proper waste disposal as part of water pollution control.
INTRODUCTION
The public health significance of water quality cannot be over emphasized. Water is vital to our existence in life and its importance in our daily life makes it imperative that thorough microbiological and physico-chemical examina-tions be conducted on water [1, 2]. Water meant for human consumption should be free from pollution, safe and acceptable. Indeed, the microbial quality of water sources should not exceed the maximum limits specified in the water quality guidelines [1]. Due to this challenge only 40 % of Kenyan population are able access safe drinking water [2]. Nakuru North Sub-county just like most of areas in the Rift valley has a problem of enteric diseases that are transmitted by taking water orally. Water in this regions is also full of extreme high concentrations of fluorine [2, 3]. Some of the major enteric diseases faced by residents include; cholera, hepatitis, amoebiasis, bacillary dysentery and salmonellosis [3]. Nakuru North Sub-county is fast growing with increasing urban population due to rapid industria-lization. This effect has led to high rate of houses being built up with unplanned sewage systems [4, 5]. All these developmentshave led to high rate of waste disposals from households and industries including industrial pollutants being discharged into water sources [6].
Previous studies have shown that up to 92 % of water used in these kind of urban centres are polluted. A propotion of 80 % of the pollution emanate from domestic waste [4, 5]. Sources of these domestic wastes are mostly from; laundry, kitchen, bathing, toilets, leaking septic tanks, and solid discharge from the houses. In addition, wastes water from cars wash, processing industries, agricultural activities, concrete brick production, pig farming and market activities also found to end up contaminating rivers and open piped water [7, 8].
This magnitude of water pollution has also been found to imbalance river ecosystem that is usually maintained by regulation of physico-chemical properties of water and the biological diversity [7]. The physico-chemical parameters that greatly impact on the quality of water include temperature, turbidity, colour, oduor, taste, suspended and floating matter. Chemical parameters include biochemical oxygen demand (BOD), organic and inorganic dissolved oxygen (DO), chemical oxygen demand (COD), chlorides, alkalinity, sulphates, pH, heavy metals and pesticides. Biological parameters include coliform bacteria and pathogens [6]. Damping of industrial wastes and wastes from agricultural activities has led to increased water pollution including bacteriological pollution. The pollution has led to increased cases of diarrhea with most of these cases being fatal.
Nakuru North Sub-county is in the Great Rift Valley in Nakuru County. The population in this region accesses their water from River Kandutura. This river traverses through the region and its water is channeled into community taps that supply water to communities living within the region. However, this water is not treated and therefore effluents of various types both from community living around the River and small industries in Nakuru town, often find their way into the river [9]. Despite the challenge of water contamination in Nakuru North Sub-county, little is known on the state of physico-chemical and microbial contamination of the waters. This study aimed at determining microbiological quality of River Kandutura and community tap’s in Nakuru North sub-county. Secondly, the study aimed at establishing whether solar disinfection can be effective in treating contaminated water. In addition, the study aimed at carrying out antimicrobial susceptibility patterns of the microbial isolates.
MATERIALS AND METHODS
Sample Size and Collection
The sample size was calculated using the formula by Barbara et al. [10] given a prevalence of 21 % as indicated below;
Where; n = sample size, p = anticipated prevalence which was 21 % (0.21) in this study, q = failure which was calculated as 100-21 giving 79 % (0.79), Z = is the appropriate value from the normal distribution for the desired confidence level which was 1.96 in this study, d = allowable error (0.05) and D = design effect. Based on confidence interval of 95 %, allowable error of 5 % and Z value of 1.96 the sample size was;
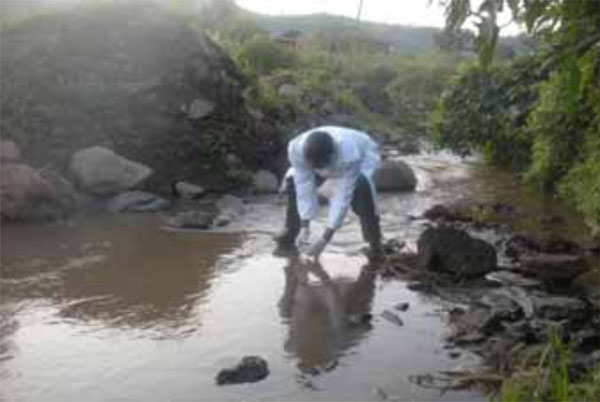
A total of 510 water samples were collected; 255 from the river at upstream, midstream and downstream of river Kandutura and another 255 randomly collected from community tap water (Figs. (1-4)). These samples were transported at low temperatures to the laboratory and were analyzed within eight hours of collection. For microbial analysis, 100 ml samples were filtered using membrane filters (Whatman GmbH, Germany), pore size 0.45μm, 47 mm diameter. The isolation and identification of microorganisms were performed following the standard microbiological technique recommended by Quinn et al. [11]. The filters were aseptically inoculated onto solidified nutrient agar media and incubated at 37 oC for 48 h for isolation of E.coli. Some of the filters were placed on tripticase soy Agar (Oxoid) and incubated at 37 ºC for 24 h to determine the total heterotrophic counts. For isolation of Shigella and Salmonella, the filters were enriched with Selenite F broth followed by careful streaking on XLD agar [12].

Collection of samples from one of the tributaries in the upsteam of River Kandutura.
Collection of samples from the midstream of River Kandutura.
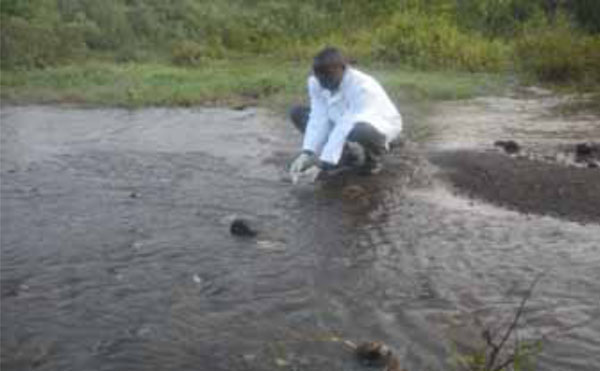
Collection of samples from the downstream of River Kandutura.
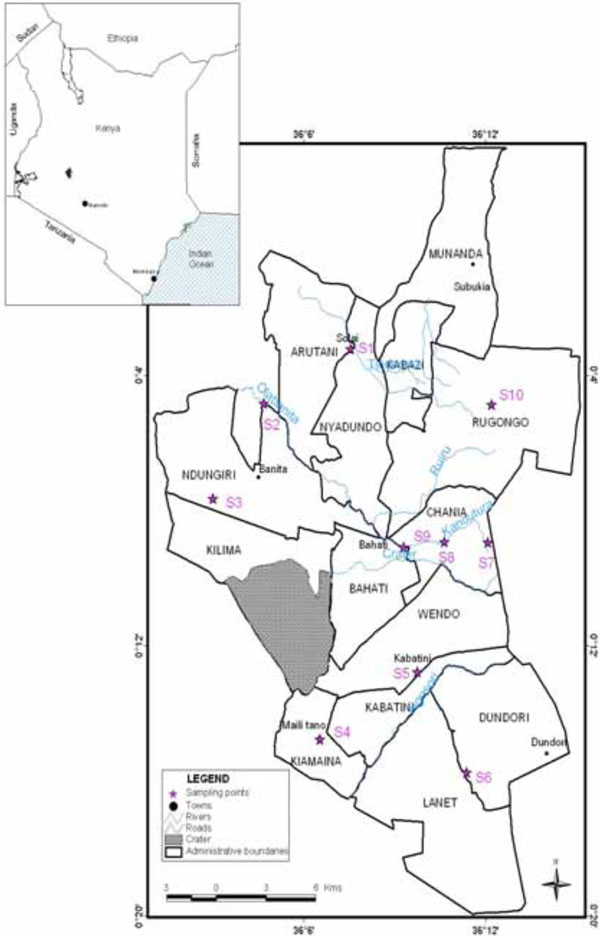
Map of the study area showing the sampling points of water from Community taps.
Microbial and physico-chemical characteristics of water from tap water and River Kandurura in Nakuru North District between January and December 2013.
| Sampling Sites | Temp (oC) |
Turb (NTU) |
pH | BOD | DO | TDS | Cl- | Fl-mg/ litre | E. coli | Shigella | Salmonella |
|---|---|---|---|---|---|---|---|---|---|---|---|
| (mg O2/l) | (mg O2/l) | (mg/l) | n/100mL (x104 ) | n/100mL (x103 ) | n/ (%) | ||||||
| S1 | 18.0 | 5.6 | 8.6 | 4.4 | 8.4 | 0.1 | 55 | 0.7 | 2(95) | 1.2(100) | 8(26.7) |
| S2 | 18.0 | 5.2 | 8.4 | 4.6 | 8.2 | 0.1 | 50 | 0.7 | 6(100) | 1.3(100) | 14(46.7) |
| S3 | 18.6 | 5.3 | 8.4 | 4.2 | 6.4 | 0.1 | 25 | 0.4 | 5(100) | 1.4(100) | 21(70) |
| S4 | 18.2 | 7.6 | 8.1 | 4.8 | 8.0 | 0.1 | 30 | 0.3 | 5(100) | 1.3(100) | 16(53.3) |
| S5 | 18.1 | 7.7 | 8.9 | 4.2 | 8.8 | 0.2 | 40 | 0.3 | 1(81) | 1.1(100) | 7(23.3) |
| S6 | 18.4 | 8.1 | 8.1 | 4.0 | 8.8 | 0.1 | 30 | 0.4 | 2(83) | 1.0(100) | 5(16.7) |
| S7 | 18.1 | 5.3 | 8.4 | 4.2 | 8.2 | 0.2 | 55 | 0.3 | 6 (100) | 1.4 (100) | 14 (48.1) |
| S8 | 18.2 | 7.6 | 8.1 | 4.8 | 8.4 | 0.1 | 35 | 0.4 | 5 (100) | 1.2 (100) | 21 (73) |
| S9 | 18.2 | 7.7 | 8.6 | 4.2 | 7.3 | 0.1 | 30 | 0.4 | 2 (90) | 1.3 (100) | 18 (45) |
| S10 | 18.6 | 8.1 | 8.4 | 4.8 | 8.5 | 0.1 | 50 | 0.3 | 5 (95) | 1.3 (100) | 15 (26.3) |
| Average | 18.24 | 6.82 | 8.4 | 4.42 | 8.1 | 0.12 | 40 | 0.42 | 3.9(94.4) | 1.25 (100) | 13.9(42.91) |
| r=values | 0.1412* | 0.1357* | 0.0758* | 0.1916** | 0.1343** | 0.2356** | 0.173* | 0.2356* | p>0.05 | ||
| WHO stds | 6 | 6.5 | >5 | 8 | 500 | 200 | 0.5–1.0. | Zero | Zero | Zero | |
| Upstream | 17.6b | 4.5c | 7.94e | 3 | 7.94 | 0.1 | 37 | 0.5 | 1(30) | 0.9 | 16 (10) |
| Midstream | 17.7b | 5.6c | 7.7e | 2.7 | 7.9 | 0.1 | 36 | 0.58 | 5(70) | 1.3 | 17(28.3) |
| Downstream | 18.3b | 7.2c | 8.1e | 2.6 | 7.8 | 0.1 | 32 | 0.4 | 8(100) | 1.5 | 37(61.7) |
| r=values | 0.4684* | 0.783* | 0.3580* | 0.2064** | 0.101** | 0.0108** | 0.123* | 0.307* | p=0.002 | p=0.001 | p=0.001 |
Monthly variation of Salmonella isolated from Community taps and River Kandutura in Nakuru North Sub-county between January and December 2013.
| Months | |||||||||||||
|---|---|---|---|---|---|---|---|---|---|---|---|---|---|
| Sampling Site | Jan | Feb | March | April | May | June | July | Aug | Sept | Oct | Nov | Dec | P-value |
| Community Taps | |||||||||||||
| E. coli (n) isolates (n=85) | 8 (100) |
7 (100) |
7 (100) |
7 (100) |
7 (100) |
7 (100) |
7 (100) |
7 (100) |
7 (100) |
7 (100) |
(100) |
7 (100) |
>0.05 |
|
Shigella (n=85) (n) isolates |
8 (100) |
7 (100) |
7 (100) |
7 (100) |
7 (100) |
7 (100) |
7 (100) |
7 (100) |
7 (100) |
7 (100) |
7 (100) |
7 (100) |
>0.05 |
|
Salmonella (n) isolates (n=85) |
8 (66.7) |
7 (66.7) |
7 (60) |
7 (13.3) |
7 (13.3) |
7 (21.3) |
7 (33.3) |
7 (46.7) |
7 (33.3) |
7 (33.3) |
7 (46.7) |
7 (53.3) |
>0.05 |
| River Kandutura | |||||||||||||
| E. coli (n) isolates (n=85) | 8 (100) |
7 (100) |
7 (100) |
7 (100) |
7 (100) |
7 (100) |
7 (100) |
7 (100) |
7 (100) |
7 (100) |
7 (100) |
7 (100) |
>0.05 |
| Shigella (n) isolates (n=85) | 8 (100) |
7 (100) |
7 (100) |
7 (100) |
7 (100) |
7 (100) |
7 (100) |
7 (100) |
7 (100) |
7 (100) |
7 (100) |
7 (100) |
>0.05 |
| Salmonella isolates (n=85) | 8 (66.7) |
7 (66.7) |
7 (46.7) |
7 (6.7) |
7 (13.3) |
7 (20) |
7 (26.7) |
7 (46.7) |
7 (26.7) |
7 (33.3) |
7 (46.7) |
7 (46.7) |
>0.05 |
Figures in brackets represent prevalence in %.
Mean Salmonella (cfu/100 ml) after solar disinfection in Nakuru North Sub-County from January to December 2013.
| Set A | Time (Hrs) | Set B | Time (Hrs) | Set C | Time (Hrs) |
|---|---|---|---|---|---|
| Mean cfu/100ml x105 | Mean cfu/100ml x105 | Mean cfu/ 100ml x 105 | |||
| 1.6 | 0 | 2.9 | 0 | 3.3 | 0 |
| 2.2 | 1 | 4.4 | 1 | 3.6 | 1 |
| 1.8 | 2 | 3.5 | 2 | 3.0 | 2 |
| 0.9 | 3 | 1.5 | 3 | 2.8 | 3 |
| 0.5 | 4 | 1.4 | 4 | 3.5 | 4 |
| 0.0 | 5 | 0.0 | 5 | 4.1 | 5 |
Cfu, colony forming unit; Set A, infected water from the water sources; B, water inoculated with commercial Salmonella and C, contaminated water from water sources which was kept in the dark.
Antimicrobial susceptibility test (%) results for the seven antimicrobials in Nakuru North from January to December 2013.
| Antibiotic | Antibiotics class | E. coli (n=98) | Shigella (n=61) | Salmonella (n=30) | ||||||
|---|---|---|---|---|---|---|---|---|---|---|
| R | I | S | R | I | S | R | I | S | ||
| CL30 | Cephalosporins | 61.2 | 2.0 | 36.8 | 9.3 | 18.4 | 72.3 | 7.7 | 12.4 | 79.9 |
| NA30 | Quinolones | 60.8 | 30.2 | 9.0 | 70.5 | 15.9 | 13.6 | 93.2 | 2.0 | 4.8 |
| C30 | Chloramphenicols | 4.3 | 4.9 | 90.8 | 4.0 | 4.6 | 91.4 | 0.0 | 1.9 | 98.1 |
| CIP5 | Fluroquinolones | 7.0 | 23.0 | 70.0 | 3.1 | 30.2 | 66.7 | 1.9 | 19.0 | 79.1 |
| CN10 | Aminoglycosides | 0.0 | 2.0 | 98.0 | 0.0 | 4.0 | 96.0 | 0.0 | 0.0 | 100.0 |
| AML10 | Penicillins | 32.7 | 19.3 | 48.0 | 22.1 | 7.6 | 70.3 | 16.4 | 1.9 | 81.7 |
| SXT25 | Sulfonamides | 18.1 | 11.6 | 70.3 | 10.5 | 8.8 | 80.7 | 2.9 | 2.9 | 94.2 |
| Mean | 26.3 | 13.3 | 60.4 | 17.1 | 12.8 | 70.1 | 17.4 | 5.7 | 76.8 | |
CL30, Cephalexin; NA30, Nalidixic Acid; C30,Chloramphenicol; CIP5, Ciprofloxacin, CN10, Gentamicin; AML10, Amoxicillin; SXT25, sulfamethoxazoletrimethoprim; R, resistant; I, intermediate; S, sensitive.
Identification of the Microorganisms
Biochemical identification was carried out using API 20E strip kit (bioMe´rieux®, Inc., France). The reagents used included API NaCl 0.85 % medium, API 20 E reagent kit, Zn reagent, oxidase, mineral oil and API 20E Analytical Profile Index. The strips were prepared by the use of an incubation box (tray and lid). In this preparation, 5 ml of distilled water was distributed into the honey-combed wells of the tray to create humid atmosphere. Inocula of pure isolates were, emulsified in 5 ml of normal saline 0.85 % NaCl to achieve a homogeneous bacterial suspension. Anaerobiosis in the tests arginine dihydrolase (ADH), lysine decarboxylase (LDC), ornithine decarboxylase (ODC), H2S production (H2S), Urease (URE), citrate utilization (CIT), fermentation/oxidation of glucose (GLU), mannitol (MAN), inositol (INO), sorbitol (SOR), rhaminose (RHA), melibiose (MEL) and arabinose (ARA), gelatinase (GEL), tryptophane deaminase (TDA), fermentation/oxidation of sugars sucrose (SAC) and amygdaline (AMY), Indol (IND) and acetoin (VP) production was maintained by overlaying with mineral oil. The incubation box was closed and incubated at a temperature 37 °C for 24 h as described by the manufacturer and the results were determined according to API 20E catalogue. The microorganisms were further identified using colony morphology, Gram staining and motility test [13].
Physico-chemical Analysis
Water temperature, pH and turbidity of water were measured directly in the field using a WTW 315 I pH meter (Weilheim, Germany) while total dissolved solids (TDS) were measured by use of WTW 330i conductometer (Germany). Dissolved oxygen (DO) was measured using a Hanna instruments 9143 oxymeter. In addition, Biological Oxygen Demand (BOD) was established through titrimetric determination of DO before and after incubation of appropriately diluted samples for five days [14].
Solar Disinfection
In order to investigate the effectiveness of solar disinfection in treating the contaminated water from community taps and River Kandutura, a modification of a method described by Oates et al. [15] was adopted. Three sets labeled A, B and C each having 6 bottles were used in determining the effectiveness of the method in water treatment using Salmonella as a representative of the pathogenic microbial isolates. Set A had infected water from the community taps and River Kandutura, B had water inoculated with commercial Salmonella Typhimurium (ATCC 13311) while C was a control with contaminated water from community taps and river Kandutura. Set A and B were exposed to sunlight for 5 h while set C was kept in the dark. Salmonella analysis was carried out on hourly basis. Exposure to sunlight was carried out for five continuous hours starting at 10 am each day for 90 sunny days [15].
Antimicrobial Sensitivity Testing
The antimicrobial susceptibility testing was carried out by use of Kirby Bauer disk diffusion method as described by the Clinical and Laboratory Standards Institute (CLSI) [13]. Sterile wire loop was used to pick 3 colonies of each Shigella spp., E. coli and Salmonella spp. followed by emulsification in 3 ml of sterile physiological saline. Standardization of the suspended colonies was performed by diluting the normal saline suspension until the turbidity matched the 0.5 McFarland Standards. A sterile cotton swab was dipped into the standardized suspension, drained, and used for inoculating 20 ml of Mueller-Hinton agar in a 150 mm disposable plate (STERLIN, UK).
The inoculated plates were air dried, and antibiotic discs (ABTEK BIOLOGICAL LTD., UK) were placed on the agar using sterile forceps and were gently pressed down to ensure contact. The following 7 antibiotic discs prepared from the most commonly used antibiotics in the study area were used; cephalexin (CL, 30 µg), nalidixic acid (NA, 30 μg), chloramphenicol (C, 30 µg), ciprofloxacin (CIP 5 ug), gentamicin (CN, 10 μg), amoxicillin (AML, 10 µg) and sulfamethoxazole-trimethoprim (SXT, 25 µg). The plates were incubated aerobically at 37 °C for 24 h. Escherichia coli (ATCC 25922) was used as control. The zones of inhibition were measured in millimeters and graded according to sensitive, intermediate or resistant [10].
Statistical Analysis
Data obtained on the number of isolated bacteria and the various parameters studied were presented in form of tables. Spearman’s rank correlation test was used to establish the relationship between the number of Salmonella isolates and the various parameters under study. ANOVA was used to compare the means of Salmonella isolates between the various sampling regions.
RESULTS
Bacterial Analysis
Out of five hundred and ten (510) samples examined, all samples were positive for Shigella, 87.4 % (446/510) for E. coli and 36.78 % (188/510) for Salmonella.E. coli isolates varied from 95 % to 100 % in water from community taps while the range was 30 % to 100 % in water from river Kandutura. The prevalence of Salmonella varied across the community taps (16.7-70 %). However, in River Kandutura, the rates of isolating Salmonella from the river, increased from upstream (10 %) to downstream (61.7 %). Frequency of E. coli and Salmonella isolation from both the tap water and the River across the seasons varied with higher rates being detected during dry season (Table 1). There was 100 % E. coli and Shigella isolation from January to December in both community taps and River Kandutura’s water. However, the Monthly Salmonella isolates ranged from 66.7 % in January and February to 13.3 % in April and May in water obtained from community taps while the variation was 66.7 % in January and February to 6.7 % in April in water obtained from River Kandutura (Table 2).
Physiochemical Analysis
Physiochemical analysis showed a variation in tested parameters across sampling points and between taps water and the sampled river water. In tap waters, the temperature ranged between 18.0-18.6 °C; turbidity 5.2-8.1; pH 8.1-8.9; BOD 4.2-4.8; DO 6.4-8.8; TDS 0.1-0.2; chlorine 25-55; Fluorine 0.3-0.7 (Table 1). In River Kandutura, temperature ranged between 17°C and 19.01 °C from upstream to downstream; turbidity 3.20 and 7.50; pH7.1and 8.5; BOD 2.0 and 3.5 while dissolved oxygen was 7.0 and 9.0. In addition, chemical analysis showed TDS ranged between 0.1 and 0.3; Chlorine 20 and 55 and Fluorine from 0.2 upstream and downstream to 0.8 upstream (Table 1).
We determined whether any physical chemical changes in water BOD, DO and TDS could have any impact on the rates of E. coli, Shigella and Salmonella contamination in both tap water and River sources. However, these factors were found to correlate positive with the rates of E. coli, ShigellaSalmonella contamination in both tap water (r<0.012) and river Kandutura (r<0.03) (Table 1).
Solar Disinfection
The number of Salmonella before exposure to sunlight was 1. 6 x 10⁵, 2.9 x 10⁵ and 3.3 x 10⁵ in set A, B and C, respectively. There was complete absence of Salmonella in set A and B after five hours of continuous exposure to sunlight. In set C, the number of Salmonella varied with time reaching a maximum of (4.1x10⁵) after five hours of exposure (Table 3).
The result showed a significantly high level (F = 22.25, d f = 2, P = 0.001) of Salmonella colony forming units from set C (20.3 x 10⁵ cfu/100 ml) compared to set B (13.7 x 10⁵ cfu/100 ml) and set A (7.00 x 10⁵ cfu/100 ml). Set B and C served as controls in the experiment. Water turbidity was not significantly different in the three sets of treatments (P > 0.05). However, mean temperature in set C (22.0 oC) was lower compared to those of set A (43.7 oC) and set B (43.8 oC).
Antimicrobial Sensitivity Test
The pure microbial isolates were tested with seven different antibiotics to establish their levels of resistance. The mean resistance in E. coli was 26.3 %, Shigella (17.1 %) and Salmonella (17.4 %). The mean intermediate resistances to the tested antimicrobials were E. coli (13.3 %), Shigella (12.8 %) and Salmonella (5.7 %). In addition, 60.4 % of E. coli, 70.1 % of Shigella and 76.8 % of Salmonella were sensitive (Table 4). There was no significant difference (p> 0.05) in resistance between E. coli, Shigella and Salmonella.
DISCUSSION
We determined the bacteriological quality of community taps and River Kandutura in Nakuru North Sub-county in Kenya. Water sampling in community taps was carried out in ten sampling points that were randomly selected. In River Kandutura, the samples were obtained from the upstream, mid stream and downstream. Water in both the community taps and River Kandutura was found to be highly contaminated with an exemption of water from the upstream of River Kandutura (Table 1). The results of this study confirm studies carried out elsewhere in Kenya that indicated high level of contamination of water sources [16]. Rivers and community taps in Kenya provide a favourable environment for the proliferation of E. coli, Shigella and Salmonella. The microorganisms originate mainly from markets, households and human wastes [17]. Outbreaks of waterborne diseases affects as many as 51 % of urban and peri-urban dwellers in Nakuru North sub-county. Typhoid fever represents 32 % of waterborne diseases that affect the inhabitants of Nakuru North sub-county [14].
A previous study carried out in Nairobi also attests to these findings [17]. However, the values obtained in this study were found to be lower than those obtained in Cameroon. The difference could be due to diverse sampling sites. The current study was carried out in peri-urban set up while the former was carried out in completely urban setting. We also determined if there was a significant difference in frequency of Salmonella infections across the regional water taps. There was no significant difference in the levels of Salmonella across the region (P>0.05). These results were contrary to those obtained from most developing countries due to diverse sampled regions and sites [1].
Although water from upstream of river Kandutura was found to be safe for drinking, water from midstream and downstream was found to be highly contaminated (Table 1). These findings agreed with a previous study carried out in Cameroon [17]. The isolation rates in these findings were found to be higher than those obtained from previous studies in Nairobi [18]. The high obtained rates could be associated with lack of storm sewers for proper disposal of storm water during rainy season and human activities around watering plants like washing of clothes, vehicles and bathing in water by communities rounding these areas. There was no significant difference in rates of E. coli, Shigella and Salmonella isolates (P>0.05) between the community taps and river Kandutura. Possible reason could be that water running in community taps was obtained from River Kandutura without treatment.
Despite sunlight having a bactericidal action against microorganisms, high number of microorganisms were isolated during the dry season compared to the rainy season (Table 2). These findings were similar to those obtained in Georgia, USA [2]. This could be attributed to high nutrient levels from the solid waste disposed in the environment and waters in the river that favour microbial multiplications [1] with low detected rates during rainy season being associated with high dilution effects of rain [12].
High turbidity has been shown to influence the number of disease causing microorganisms [7]. In this study, a relatively high level of turbidity was obtained indicating possibilities of contamination of water sources [2]. The pH value levels varied across the sampled water. The pH levels varied from neutral and alkaline that is conducive for E. coli, Shigella and Salmonella growth [7]. Total TDS test was assessed as an indicator, for the acceptance and rejection of contaminated water [14]. Values obtained for TDS were found within the acceptable limits of 500 and 1000 mg/l [17]. The high pollution of water and the levels of BOD can be associated with natural sources of pollution, sewage runoff, possible industrial waste water and chemical used in the water treatment process of Nakuru [4].Due to presence of nutrients provided high organic matter may significantly led to high levels of E. coli, Shigella and Salmonella spp. [8]. The Cl- and Fl-content and the water samples in this study was found to be within the acceptable limits. In addition, this suggested that the water used in this area is hard and possible derived from volcano rocks of Menengai [17].
The physico-chemical parameters analysed in this study were found to be consistent with previous studies carried out in Sub-Saharan Africa where some of the levels were higher that the recommended levels by World Health Organization [6, 19]. However, these contaminants may cause cosmetic effect (such as taste, odour, or colour) in drinking water leading to poor quality water for human consumption.
Solar disinfection was found to be an effective method of treating water from community taps and River Kandutura (Table 3). These results differ with those that were obtained by Oates et al. [15]. According to them, water has to be left outside for two days for effective disinfection to take place. The current study established that three to five hours of continuous exposure of water to sunlight from 10 am to 5.00 pm is effective in eliminating Salmonella in water. This difference could be attributed to the duration of sunny periods within a day and also the season during which the method is used [20].
We established that the microbial isolates were most resistant to nalidixic acid, cephalexin and amoxicillin. The antibiotics were most sensitive to gentamicin, chloramphenicol and sulfa-trimethoprim. This study suggests that nalidixic acid, cephalexin and amoxicillin have a low potential of controlling the tested microorganisms. The results agree with a previous study carried out in Kenya [21]. On the other hand, some strains of Salmonella have capsular K and Vi antigens, which protect them from access to antimicrobials [18]. Moreover, water sources having antimicrobial deposits, use of antimicrobials as animal feed addictives and increased use of antimicrobial as disinfectants in the environment have greatly contributed to antimicrobial resistance [22].
CONCLUSION AND RECOMMENDATION
Water sources in Nakuru North sub-county are highly contaminated with microorganisms that have a high potential of causing infections. However, this problem can be solved by exposing the water to sunlight in PET bottles for 5 h. There is a need to enforce stringent measures on public, personal and environmental hygiene for the control water pollution.
CONFLICT OF INTEREST
The authors confirm that this article content has no conflict of interest.
ACKNOWLEDGEMENTS
The authors would like to thank Rift Valley Water resource Management and AMEC Laboratories for permitting us to conduct this study in their laboratory. The authors would also like to appreciate Sister Zipporah Ngoiri and Brother Tony Dolan for funding this study.