All published articles of this journal are available on ScienceDirect.

Saltwater Intrusion Impacts Microbial Diversity and Function in Groundwater Ecosystems
Abstract
Background:
Groundwater ecosystem services provided by microbial communities are essential for the maintenance of water quality. For example, nitrate contamination is a recognised health and ecosystem issue in most groundwater systems, often alleviated through microbial processes. The effects of climate change, including increasing salinity from rising sea levels, or over-abstraction, on these communities are largely unknown.
Methods:
This study uses a combination of culture-dependent (growth curves, isolation of bacteria) and culture-independent (16S rRNA gene sequencing) methods to identify the potential effects of saltwater intrusion on groundwater microbes and their ecosystem functions.
Results:
Some groundwater microbial communities are negatively impacted by increasing chloride concentrations, including declines in bacteria responsible for nitrate and ammonia removal. These ecosystems should be prioritised for future protection from sea level rise or increased extraction of groundwater for agriculture and other uses. Other microbial communities are stimulated in the presence of chloride, often caused by an increase in abundance of salt-tolerant heterotrophic bacteria using sugars, peptides, or organic acids for energy.
Conclusion:
There have been no previous studies investigating the impact of chloride on Aotearoa New Zealand groundwaters. The identification of keystone species that are affected by increasing salinity, which have a disproportionately large effect on the ecosystem and low functional redundancy, is essential. Water management decisions about future abstraction limits and defences against sea level rise can be underpinned by robust scientific knowledge about microbial community sensitivity to salinity.
1. INTRODUCTION
1.1. Groundwater Ecosystems
Groundwater aquifers are dynamic ecosystems that host a wide range of micro- and macro-organisms. They are interconnected with terrestrial and aquatic systems and contain a wide variety of dissolved substances, derived both from biogeochemical and abiotic reactions within the aquifer as well as via recharge from rainfall. Groundwater ecosystems include bacteria and archaea, as well as larger organisms known as stygofauna; specialised invertebrates that inhabit subsurface habitats. Together, the groundwater communities provide essential ecosystem services, including purification of drinking water; cycling of nutrients such as carbon, nitrogen, and sulfur; and degradation of anthropogenic pollutants [1].
1.2. Saltwater Intrusion
In coastal areas, groundwater aquifers may be at risk from saltwater intrusion [2, 3]. As saline water is denser than freshwater, seawater forms a wedge under the freshwater. The boundary or interface between the two types of water will shift towards the sea during wetter months when there is more freshwater in the system and shift inland during the drier months [4]. If sea level rise occurs, the saline interface will move further inland and could impact groundwater wells which have historically not been affected by the movement of seawater during the dry months. Pumping too much water from these wells can also draw seawater into the bore [3].
Typical fresh groundwater contains approximately 10-30 mg l-1 Cl- [5], while seawater has approximately 19.4 g l-1 Cl- [6]. It takes just a small amount of saltwater intrusion (around 1.2%) into a groundwater source used for drinking water to have noticeable effects [5]. The “aesthetic” guideline value (i.e. for taste and preventing corrosion) for chloride in drinking water in Aotearoa New Zealand is 250 mg l-1 Cl- [7]. However, safe limits for chloride for the health of an entire ecosystem have not yet been determined for Aotearoa New Zealand, or overseas [8-11].
1.3. Effects of Chloride on Microbes
Microbes have two potential strategies for adapting to high chloride environments; the ‘high-salt-in’ and ‘low-salt-in’ approaches [12]. With ‘high-salt-in’, microbes accumulate salts, usually KCl, within cells to provide osmotic balance. This is energetically favourable but requires the adaptation of all enzymes within the cell to function with high salt concentrations and is only found in certain halophilic archaea. The ‘low-salt-in’ option, which is used by most halotolerant bacteria, relies on the accumulation of organic solutes, such as glycine betaine or ectoine, to balance the osmotic stress. This strategy requires a high level of energy production, e.g. from photosynthesis, aerobic respiration, or denitrification, but allows a microbe to adapt rapidly to changing conditions. Types of metabolisms that generate less energy, such as autotrophic nitrite or ammonia oxidation, are therefore unlikely to be found in high salt environments. Groundwater crustaceans are highly sensitive to increasing NaCl levels [13], as are other freshwater species [10], but the effects of chloride on groundwater microbes have rarely been investigated.
1.4. Objectives of this Study
This study aims to investigate the effects of increasing chloride concentrations on microbial diversity within a range of microbial communities found in Aotearoa New Zealand groundwater ecosystems, and to determine the consequences of saltwater intrusion on essential ecosystem services. There have been few previous studies investigating the impact of chloride on groundwater ecosystems [14, 15], and none have been carried out on Aotearoa New Zealand groundwaters.
2. MATERIALS AND METHODS
2.1. Sample Collection
Groundwater samples were collected from 10 different sites on the North and South islands of Aotearoa New Zealand. The Waikato samples were collected from sites around Lake Taupō and were from sand and ignimbrite aquifers, while the Canterbury regions samples were collected from gravel aquifers. Both Waikato and Canterbury regions have a high proportion of dairy farming, which can lead to nitrate contamination of groundwater, a recognised health issue [16-18]. Samples for this study were selected to have a range of nitrate (below the detection limit to 19.43 mg l-1) and dissolved oxygen (4.5-95.3%) concentrations (Table 1).
In the field, groundwater samples were collected at various bores by GNS Science in the Waikato region or by staff from the Institute of Environmental Science and Research (ESR) in the Canterbury region, following well purging and stabilisation of the field measurements (pH and electrical conductivity) (Pro10 portable meter, YSI). Samples were collected in 1 L pre-autoclaved bottles, using nitrile gloves. Samples were transported to the laboratory at room temperature and stored at 4 °C.
2.2. Microbial Culture under Varying Chloride Concentrations and Growth Measurements
Cultures of the microbial communities were prepared from the groundwater samples and exposed to varying chloride concentrations with daily measuring of growth rates. The cultures were sampled daily, and DNA was extracted from these samples to determine the microbial diversity and abundance in the community by sequencing the 16S rRNA marker gene
Microbial cultures were set up in GN medium as described previously [19]. In addition, the GN medium also contained 1 ml l-1 trace elements solution (1.5 g nitrilotriacetic acid; 0.2 g Fe(NH4)2(SO4)2·6H2O; 0.2 g Na2SeO3; 0.1 g CoCl2·6H2O; 0.1 g MnSO4·2H2O; 0.1 g Na2MoO4·2H2O; 0.1 g Na2WO4·2H2O; 0.1 g ZnSO4·7H2O; 0.04 g AlCl3·6H2O; 0.025 g NiCl2·6H2O; 0.01 g H3BO3; 0.01 g CuSO4·5H2O) and 1 ml l-1 FeEDTA solution (1.54 g FeSO4·7H2O; 2.06 g Na2EDTA).
| Sample ID | Sample Site | Well Depth (m) | Temperature (°C) | pH | Cl-(mg l-1) | Dissolved O2 (%) |
NO3-N (mg l-1) |
| AB | Acacia Bay, Waikato | 62 | 14.4 | 7.15 | 18.5 | 20.0 | 19.43 |
| EEG | Silverstream, Canterbury | 4.5 | 10.8 | 6.66 | 13.2 | 12.8 | 6.70 |
| EP | Epro Compound, Waikato | n.d. | 16.8 | 6.26 | 8.55 | 53.9 | 4.46 |
| KH | Kuratau Hall, Waikato | 4.6 | 15.3 | 6.20 | 4.64 | 8.3 | 0.21 |
| KN | Kuratau NGMP site, Waikato | 5.0 | 16.3 | 6.50 | 4.53 | 69.6 | 0.20 |
| LA | Law site, Waikato | 55 | 11.7 | 6.35 | 9.09 | 95.3 | 4.98 |
| NEG | Silverstream, Canterbury | 4.5 | 9.0 | 6.49 | 12.3 | 4.5 | 4.40 |
| NTG | Silverstream, Canterbury | 4.9 | 14.8 | 6.33 | n.d. | 7.1 | 5.47 |
| OM | Omori, Waikato | 25.5 | 13.8 | 6.6 | 5.6 | 5.3 | b.d.l. |
| WA | Waituhi, Waikato | 8.0 | 13.8 | 6.17 | 4.78 | 64.1 | 1.34 |
Groundwater samples were filtered through a 0.1 μm filter, which was then placed in a medium designed to support denitrification. The headspaces were adjusted to match those of the sample in situ and cultures were incubated at 16 °C with shaking at 150 r.p.m.
Stable mixed microbial cultures from each sample were used to inoculate triplicate tubes containing the same medium with the addition of either low, medium, or high chloride concentrations in the form of sea salt (Cerebos), and controls with no chloride. Human drinking water limits (250 mg l-1) were used for a “low” level of chloride. “Medium” chloride levels were defined as upper limits for guideline values for groundwater used for irrigating crops (700 mg l-1 Cl- [20],), and “high” as upper limits for guidelines for drinking water for livestock (2000 mg l-1 Cl- [21],), common applications for groundwater in Aotearoa New Zealand. Chloride concentrations above these levels would render groundwater unusable for agriculture, and ecosystems within groundwater aquifers are likely to be affected as well.
OD600 (optical density or cloudiness) was measured daily using an adaptor (Perkin-Elmer) that allowed the tubes to be directly inserted into a Halo Vis-10 spectrophotometer (Dynamica Scientific) without subsampling cultures.
2.3. DNA Extraction and Sequencing
Each day, 2 ml of culture medium was removed from each control and high chloride replicate tube and frozen at -20 °C. At the end of the growth experiment, the samples were defrosted, and DNA was extracted using an alkaline lysis method. 2 ml of culture medium was centrifuged at 27,000 x g for 15 min and the supernatant was removed. 40 µl of an alkaline lysis buffer (5% 1M NaOH, 0.25% SDS) was added to the cell pellet before vortexing and incubation at 95 °C for 15 minutes with shaking at 500 r.p.m. Tubes were then centrifuged at 15,000 x g for ten minutes and the supernatant was removed to a LoBind microcentrifuge tube (Eppendorf). DNA was frozen at -20 °C until further analysis.
Due to cost, it was not possible to sequence DNA from all replicate tubes. For five of the samples (AB, EEG, EP, NTG, OM), DNA from each replicate tube was sequenced individually. These were chosen to represent a range of responses to chloride, based on the OD600 graphs. For the other five samples (KH, KN, LA, NEG, WA), DNA from replicate tubes was combined before sequencing. DNA was sequenced from samples on day 7 (day 8 for OM samples) to determine the effect of high chloride on the growth of these microbial communities. DNA was also sequenced from day 0, to confirm that the microbial communities were similar across conditions at the start of the experiment. A Principal Component Analysis was carried out on these sequences and showed that the biological replicates clustered closely together, indicating similar communities within but not across samples (Fig. S1).
For sequencing, extracted DNA was amplified using universal primers for the V4 region of the 16S rRNA gene [22] with adaptor sequences for the Illumina MiSeq: 515F 5’-TCG TCG GCA GCG TCA GAT GTG TAT AAG AGA CAG GTG YCA GCM GCC GCG GTA A-3’; 806R 5’-GTC TCG TGG GCT CGG AGA TGT GTA TAA GAG ACA GGG ACT ACN VGG GTW TCT AAT-3’. PCR was carried out in 50 µl reaction volumes containing 100 µM dNTPs, 0.5 µM primers, 1U i-Taq (iNtRON Biotechnology), and 7 µl of an enhancer solution (2.7 M betaine, 0.2 M trehalose, 6.7 mM DTT, 0.055 mg ml-1 bovine serum albumin (BSA) and 0.067% DMSO). The final concentration of MgCl2 was 1.5 mM. DNA templates were used at final concentrations of 10 – 50 ng/reaction.
PCR amplifications were performed using a T100 thermal cycler (Bio-Rad). The PCR conditions were as follows: 94 °C for 3 minutes; 35 cycles consisting of 94 °C for 45 seconds, 50 °C for 60 seconds, and 72 °C for 90 seconds; and a final elongation step at 72 °C for 10 minutes. Three PCR amplicons (~300 bp) for each sample were pooled and purified using the NucleoSpin Gel and PCR Clean-up kit (Macherey-Nagel). Amplicon libraries using the PCR products were prepared and sequenced by Macrogen Inc.
2.4. Analysis and Visualisation of DNA Sequences
Raw fastq reads were uploaded to the Galaxy web platform, and the public server (https://usegalaxy.org.au) was used to perform all analysis [23]. All settings for the individual pipeline wrappers were default settings unless stated otherwise. The quality of raw read data was assessed using FastQC (v0.69) [24]. The files were paired using the inbuilt Galaxy function Build List of Dataset Pairs. Reads were classified using Kraken [25] using the MiniKraken database for classification and Kraken-mpa-report to produce an OTU (Operational Taxonomic Unit) table (available online). The OTU table created by Kraken was uploaded to the Shaman [26] public server (https://shaman.pasteur.fr/) for visualisation.
2.5. Isolation of Bacteria
Cultures from the growth rate experiment were transferred into fresh culture medium (1:10 v/v) media and incubated under the same conditions to isolate bacteria, with the aim to identify individual species that could be used to confirm the DNA sequencing results and also determine potential species interactions. These cultures were then serially diluted to extinction in a liquid medium or inoculated onto a solid medium (solidified with 1.5% agar, with the addition of 100 mg l-1 cycloheximide to inhibit fungal growth) from which individual bacterial colonies could be isolated. The resultant cultures were checked for axenic purity via phase-contrast microscopy (Eclipse Ni; Nikon). Not all cultures were able to be isolated in this way, but the dominant species in each culture was identified using DNA sequencing of either the 16S rRNA gene or a gene involved in the final step of denitrification; nosZ.
DNA was extracted from liquid cultures using the alkaline lysis method, and PCR amplifications were performed as above. The PCR conditions were as follows: 94 °C for 5 minutes; 30 cycles consisting of 94 °C for 45 seconds, 55 °C for 60 seconds, and 72 °C for 90 seconds; and a final elongation step at 72 °C for 5 minutes. PCR amplification of colonies on a solid medium were performed by using a sterile wooden toothpick to inoculate a single colony into the PCR master mix.
The 16S rRNA gene for bacteria was targeted using the primer pair 9F CCG AAT TCG TCG ACA ACA GAG TTT GAT CCT GGC TCA G and 1492R CCC GGG ATC CAA GCT TAC GGT TAC CTT GTT ACG ACT T [27]. The nosZ gene was targeted using the primer pair nosZ1F (WCS YTG TTC MTC GAC AGC CAG) and nosZ1R (ATG TCG ATC ARC TGV KCR TTY TC) [28]. PCR reactions that produced a product of the expected size were cleaned using the NucleoSpin Gel and PCR Clean-up kit (Macherey-Nagel), before subsequent sequencing by Macrogen Inc.
The OTU table for all 16S rRNA gene sequences is available at Zenodo: https://doi.org/10.5281/zenodo.6029769
3. RESULTS AND DISCUSSION
Each groundwater culture responded to increasing chloride concentrations slightly differently, depending on the microbial community within the sample. Some microbial communities showed declines in growth only in response to high chloride concentrations, while other samples had significant increases in growth as chloride concentrations increased. As sea salt was used as a source of chloride, these results are representative of an intrusion of “standard” seawater (salinity of 35) [29]. Although saltwater is primarily composed of chloride and sodium ions (54% and 30%, respectively), the effects seen in this study could be caused by other ions present, such as sulfate (7.5%) or magnesium (3.6%) [29].
3.1. Growth of Microbial Cultures
The optical density (cloudiness) of the microbial cultures was measured daily at a wavelength of 600 nm (OD600) as a proxy for the concentration of cells. There was a variety of responses to chloride between the samples. Most of the samples (EEG, KH, KN, LA, NEG, WA) showed very little difference in OD600 across the range of chloride concentrations (Fig. S2).
The EP sample had similar OD600 measurements for the control, low and medium conditions, while the replicates with high chloride showed significantly lower cell density (Fig. 1, panel A). In contrast, the NTG sample showed increased OD600 in response to the increasing concentrations of chloride, with the highest OD600 reached after 5 days with 2000 mg/l-1 Cl- (Fig. 1, panel B). The AB and OM samples also showed an increase in OD600 with the medium (750 mg/l-1) and high (2000 mg/l-1) concentrations (Fig. S2).
3.2. Differences in Genera between Control and High Chloride Conditions
There were 11 genera that showed more than 10% difference in abundance between the control and high chloride conditions, listed in Table 2. The majority of these genera showed a substantial decrease in response to high chloride. A range of metabolisms was identified, including denitrification and ammonia oxidation, heterotrophy, and phototrophy. It is important to note that the metabolic capabilities identified in this study are only predictions based on sequencing a single marker gene and what is known from isolated, closely related species. However, more than 80% of bacteria and archaea detected in the environment have not been isolated, and their metabolisms are largely unknown [30]. The bacteria cultured during this study, and their metabolic capabilities, are discussed later [31-41].
| Genus | Phylum |
Maximum Difference in one Sample (Sample Name) |
Median Difference across all Samples | Energy Sources | References |
| Albidiferax | Pseudomonadota | -100 % (NTG) | 0 % | Fe(III), nitrate, organic acids. | [31] |
| Alteromonas | Pseudomonadota | 74 % (KN) | 3 % | Carbohydrates, peptides. | [32] |
| Brevundimonas | Pseudomonadota | 181 % (EP) | 78 % | Peptides, sugars, organic acids. | [33] |
| Ca. Accumulibacter | Pseudomonadota | -52 % (NTG) | 0 % | N2-fixation, fatty acids, nitrate. | [34] |
| Lachnoclostridium | Bacillota | -61 % (NEG) | -17 % | Sugars, plant polysaccharides. | [35] |
| Nitrosospira | Pseudomonadota | -99 % (NTG) | -20 % | Ammonia oxidation. | [36] |
| Pseudomonas | Pseudomonadota | -97 % (NTG) | 0 % | Nitrate, sugars, aromatic compounds, hydrocarbons. | [37] |
| Rhodomicrobium | Pseudomonadota | 17 % (NTG) | 9 % | Light, organic acids, methanol, H2, Fe(II). | [38] |
| Salmonella | Pseudomonadota | -10 % (KH) | -5 % | Sugars, organic acids, peptides, nitrate. | [39] |
| Sinorhizobium | Pseudomonadota | 441 % (KH) | 8 % | N2-fixation, peptides, sugar alcohols, organic acids. | [40] |
| Tannerella | Bacteroidota | -59 % (NTG) | 0 % | Peptides, blood, H2. | [41] |
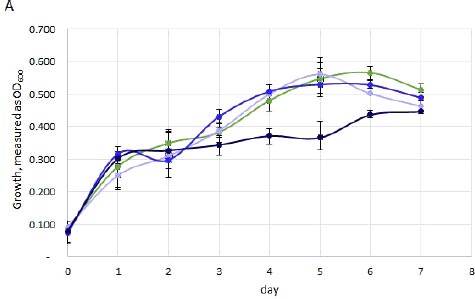
Green line, control (0 mg/l-1 Cl-); light blue line, low (250 mg/l-1 Cl-); mid blue line, medium (700 mg/l-1 Cl-); dark blue line, high (2000 mg/l-1 Cl-). The averages from three biological replicates are plotted; range bars indicate individual replicate values.
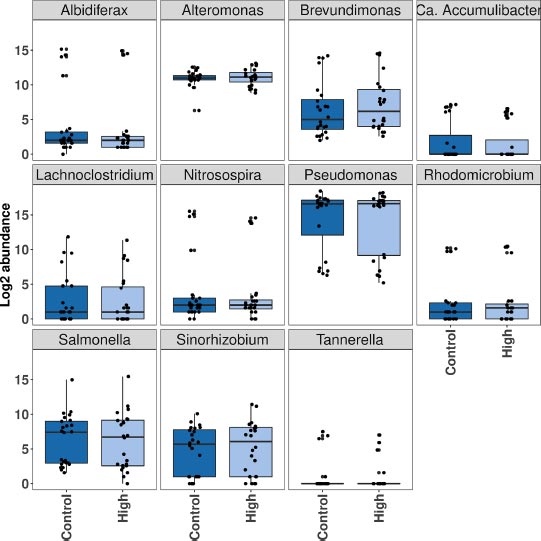
There was wide variability across samples for some of these genera. The boxplots in Fig. (2) shows the general trends in differences in abundance between control conditions (0 mg l-1 Cl-) and high chloride conditions (2000 mg l-1 Cl-). This also highlights the wide range of abundance across groundwater samples. However, sometimes individual samples showed an increase in abundance even though the overall trend was decreasing due to differences in the diversity of the original microbial community and interactions between community members, such as competition for secondary metabolites. In addition, some samples were more affected by high chloride than others: NTG saw a substantial decrease in six of these genera, and an increase in two, while OM had no changes of more than 10% of abundance for any genus.
The following genera showed the most significant increases or decreases:
Brevundimonas increased in abundance in all samples (maximum 181%) except NEG, although this was not always more than 0.1% of reads. These bacteria are heterotrophs, which use peptides, sugars, and organic acids for their energy sources. They can grow without NaCl, but show optimum growth with 15-20 g l-1 NaCl (9-12 g l-1 Cl-) [31-33].
Sinorhizobium sequences increased in abundance in three samples, with a maximum increase of 441% in the KH sample. These bacteria are also heterotrophs, using organic acids, peptides, or sugars for energy, and are capable of reducing nitrate as well as fixing dinitrogen gas. Most strains grow well with 1% NaCl, although a few tolerate up to 4.5% [42].
There were also some more surprising results in the genus data. Alteromonas was substantially different in seven samples, although four of these showed an increase in abundance with high chloride (15 -88% increase), and three showed a decrease (12 to 65%). These bacteria are abundant in freshwater but have also been isolated from seawater, and some species can tolerate up to 20% NaCl (120 g l-1 Cl-) [43]. Alteromonas are heterotrophs but grow primarily on carbohydrates and peptides. As the GN medium contained only nitrate and organic acids as energy sources, the bacteria may have gained their energy from dead cells, which increased in availability as bacteria that were not able to cope with high chloride died.
(>10% difference across >0.1% of sample reads). Abundance is the total number of reads from all samples.
Nitrosospira, which oxidises ammonia for energy, showed a substantial decrease in the NTG and EP samples. As the GN medium does not contain ammonia, Nitrosospira must rely on the transformation of dinitrogen gas into ammonium by nitrogen-fixing bacteria such as Sinorhizobium, or the conversion of nitrate to ammonium (dissimilatory nitrate reduction to ammonium, DNRA) by other microbes such as Salmonella or Pseudomonas under anaerobic conditions. A decrease in the nitrogen-fixing or DNRA bacteria due to a lack of tolerance to salt would lead to a concomitant decrease in Nitrosospira.
There can be significant differences between species and strains within genera, which means that different responses to high chloride conditions may not be apparent when looking at the genus level. To further investigate relationships between microbial diversity and chloride concentration, the DNA sequences were next classified to species level.
3.3. Differences in Species between Control and High Chloride Conditions
In total, there were 34 species that showed at least a 10% difference in abundance between control and high chloride conditions, which comprised at least 0.01% of all reads for a sample (Table 3). This table also includes information on known oxygen preference, NaCl tolerance, and metabolism. Many of these species were identified as different in several samples, and as with the genera, some species increased in some samples and decreased in others.
Alteromonas mediterranea showed more than a 10% difference in abundance between control and high chloride conditions in all samples. However, six of these had a substantial decrease (maximum 46% decrease, NTG sample), and four samples showed a substantial increase (maximum 141% increase, KN sample). This shows that the salt tolerance of individual species is not solely responsible for the changes in abundance seen and that understanding interactions between community members and their metabolisms is critical for analysing the effects of environmental changes.
Brevundimonas subvibrioides were identified as differential in six samples and increased in abundance in all of these. Five Pseudomonas species were also identified as substantially different in at least half the samples (Table 3). Pseudomonas, primarily sp. TKP, dominated eight of the samples, but changes in abundance were sample-specific; the KH, KN, LA, and NEG samples all showed increases under high chloride, while the AB, EEG, NTG, and WA had decreases in abundance for some or all of the five Pseudomonas species [43-67].
Notably, the only two samples not dominated by Pseudomonas were the two which had dramatic differences in OD in response to high chloride, EP, and NTG (Fig. 1). In the EP samples, Nitrosospira multiformis and Albidiferax ferrireducens were the most prevalent species, with N. multiformis comprising 56% of reads in the control sequences classified to species level and 38% in the high chloride, while A. ferrireducens made up 37% and 52%, respectively. The NTG samples, meanwhile had 72% of species sequences classified as B. subvibrioides in the control replicates, and 82% in the high chloride sequences.
| Species |
Substantially Different in Number of Samples |
Maximum Difference in one Sample (sample name) |
Median Difference across all Samples | Oxygen Preference | NaCl Tolerance (%) | Energy Sources | References |
| Alteromonas mediterranea | 10 | 141 % (KH) | -16 % | A | 15-20 | Peptides. | [43] |
| Pseudomonas sp. TKP | 8 | 80 % (NEG) | 8 % | n.d. | n.d. | n.d. | [44] |
| Pseudomonas aeruginosa | 8 | 68 % (NEG) | 0 % | F | <8.5 | Nitrate, organic acids, sugars, amino acids. | [37] |
| Pseudomonas stutzeri | 7 | -92 % (NTG) | -2 % | A | 1-5 | Nitrate, sugars, starch, organic acids. | [37] |
| Brevundimonas subvibrioides | 6 | 360 % (KH) | 68 % | A | 0.5-2 | Peptides, sugars, organic acids. | [33] |
| Pseudomonas sp. ATCC 13867 | 6 | 57 % (NEG) | 2 % | F | n.d. | Nitrate, sugars, organic acids. | [45] |
| Pseudomonas resinovorans | 5 | 73 % (NEG) | 0 % | A | 7 | Resins, phenanthrene, peptides. | [46] |
| Sinorhizobium fredii | 4 | 553 % (KH) | 22 % | A | 1-3 | N2-fixation, peptides, sugar alcohols. | [47] |
| Albidiferax ferrireducens | 3 | -100 % (NTG) | 13 % | F | n.d. | Fe(III), nitrate, organic acids. | [31] |
| Escherichia coli | 3 | -49 % (EEG) | 22 % | F | n.d. | Sugars, organic acids. | [48] |
| Salmonella enterica | 3 | -39 % (EEG) | 14 % | F | n.d. | Animal/human pathogen. Peptides, sugars. | [39] |
| Ca. Liberibacter asiaticus | 3 | 32 % (NTG) | 6 % | A | n.d. | Plant pathogen. Keto acid, glutamine. | [49] |
| Clostridium perfringens | 2 | 118 % (NEG) | 0 % | A | 0-6.5 | Peptides, blood, sugars. | [50] |
| Ca. Symbiobacter mobilis | 2 | -57 % (OM) | 0 % | µ | n.d. | Bacterial symbiont. Acetate. | [51] |
| Variovorax paradoxus | 2 | -53 % (OM) | -9 % | A | n.d. | Sugars, H2. | [52] |
| Comamonas testosteroni | 2 | -47 % (OM) | -44 % | A | 3 | Nitrate, testosterone, amino acids, organic acids. | [53] |
| Ca. Accumulibacter phosphatis | 2 | -44 % (EP) | 0 % | An | 1.4 | Ammonia oxidation, organic acids. | [54] |
| Parvibaculum lavamentivorans | 2 | 42 % (NTG) | 9 % | A | n.d. | Surfactants, organic acids. | [55] |
| Klebsiella pneumoniae | 2 | 34 % (NTG) | 0 % | F | n.d. | Sugars, sugar alcohols, amino acids. | [56] |
| Bartonella australis | 2 | 25 % (NTG) | 0 % | F | 0.5 | Animal pathogen. Peptides, sheep blood. | [57] |
| Nitrosospira multiformis | 1 | -99 % (NTG) | -49 % | A | n.d. | Ammonia oxidation. | [36] |
| Rhodanobacter denitrificans | 1 | -98 % (NTG) | -14 % | F | 2 | Nitrate, nitrite, nitrous oxide, sugars, organic acid. | [58] |
| Azospira oryzae | 1 | - 51 % (EP) | 0 % | µ | <2 | N2-fixation, organic acids, ethanol. | [59] |
| Tannerella forsythia | 1 | -48 % (NTG) | 0% | An | n.d. | Peptides, blood, H2. | [41] |
| Rhodomicrobium vannielii | 1 | 44 % (NTG) | 22 % | F | n.d. | Light, organic acids, methanol, H2, Fe(II). | [38] |
| Laribacter hongkongensis | 1 | -39 % (EP) | 0 % | F | 2 | Nitrate, peptides. | [60] |
| Klebsiella variicola | 1 | 36 % (NTG) | 0 % | A | n.d. | N2-fixation, peptides, organic acids, rhamnose. | [61] |
| Clostridium saccharolyticum | 1 | -33 % (NEG) | 0 % | A | n.d. | Sugars, blood, peptides, nitrate | [50] |
| Magnetospirillum magneticum | 1 | -33 % (EP) | 0 % | µ | <1 | Tricarboxylic acid intermediates, nitrate. | [62] |
| Sideroxydans lithotrophicus | 1 | -42 % (EP) | -21 % | µ | n.d. | Fe(II). | [63] |
| Rhodopseudomonas palustris | 1 | 30 % (NTG) | 2 % | F | n.d. | Light, H2, thiosulfate, peptides, organic acids. | [64] |
| Lachnoclostridium phytofermentans | 1 | -24 % (EEG) | 0 % | An | n.d. | Plant polysaccharides. | [65] |
| Plautia stali symbiont | 1 | -19 % (AB) | -9 % | A | n.d. | Insect symbiont. Sugars. | [66] |
| Hyphomicrobium nitrativorans | 1 | 15 % (NTG) | 0 % | A | n.d. | Nitrate, methanol, methylamine, CO2. | [67] |
Two potentially pathogenic species, Escherichia coli and Salmonella enterica showed promising decreases in abundance of up to 49% under high chloride conditions (in two and three samples, respectively), but these two species, as well as other human pathogens, Klebsiella pneumoniae and K. variicola, increased in abundance in the NTG sample.
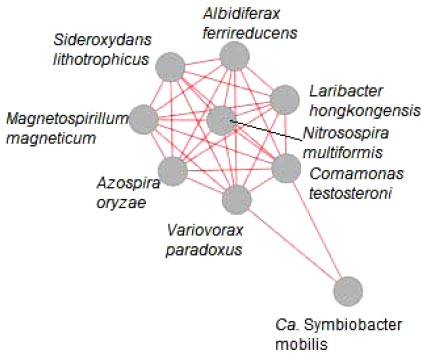
To infer specific interactions between species, network plots were created using the species sequences uploaded to the Shaman server (https://shaman.pasteur.fr/), based on DESeq2 differential analysis. A section of the network plot is shown in Fig. (3).
N. multiformis was positively correlated with eight other species (Fig. 3), including two which could act as its source of ammonia. Azospira oryzae is a nitrogen-fixing bacterium [54-59] which also showed a 51% decrease in abundance in the EP sample, and Laribacter hongkongensis, which converts arginine to ammonia, decreased by 39% in the EP sample.
This cluster also included Albidiferax ferrireducens, which was isolated from coastal aquifer sediment [68-70] and is presumably highly tolerant to NaCl. This species showed no substantial change of abundance in the EP sample but decreased 100% (2448 reads to 5) in the NTG sample. As A. ferrireducens reduces Fe(III) to Fe(II), its decline could be linked to Sideroxydans lithotrophicus which completes the reverse reaction by oxidising Fe(II) to Fe(III) [63] and also showed a decrease in abundance in several samples.
3.4. Bacterial Isolates
Following serial dilutions of the control or high chloride tubes, and/or plating out onto a solid medium, a range of isolates and mixed cultures comprising a few species were grown. The aim was to identify individual species that could be used to confirm the DNA sequencing results, and also to determine potential interactions between species. Although many bacterial species cannot currently be isolated in the laboratory [71], previous work has shown that 16S rRNA gene amplicon sequencing does not always accurately reflect cultivatable strains [72].
Isolates were identified through DNA sequencing of the 16S rRNA marker gene, while a functional gene involved in denitrification (nosZ) was sequenced from the mixed community to identify specific bacteria. No archaea were isolated – this is consistent with the 16S rRNA gene sequencing where no sample contained more than ten reads classified as archaea.
Pseudomonas species were isolated from many of the control tubes (Table 4), reflecting the high abundance of these bacteria in the original groundwater samples. There was more diversity among the high chloride cultures, probably due to the decline of the dominant Pseudomonas allowing competing species access to nutrients. These included several genera or species previously identified in the sequencing data, including Klebsiella and Sinorhizobium [73-79].
Pseudomonas are key members of the denitrifying community. Their sensitivity to chloride may mean that the removal of nitrate is negatively impacted in the event of saltwater intrusion into these groundwater aquifers, although their role could be taken over by salt-tolerant denitrifiers such as Salmonella or Hyphomicrobium. There may also be other impacts on the nitrogen cycle with an increased abundance of Rhizobium and Sinorhizobium, nitrogen-fixing bacteria which convert dinitrogen to ammonia, and Klebsiella species that use ammonia for their nitrogen source. It is important to be able to identify keystone species that carry out essential functions underpinning ecosystems and influencing many other organisms. Further culturing work will be able to determine the specific chloride tolerance of these isolates and the potential impact of saltwater intrusion on ecological functions.
The isolation of a Microvirgula species from the WA sample, and a Cupriavidus species from the KH sample, was unexpected. Microvirgula is an unusual aerobic denitrifier [79] that was not identified at all in the sequencing data, and there were only 34 reads in total assigned to its family Neisseriaceae, with none in the WA sample. This may be due to known biases during the DNA extraction, amplification, and sequencing processes [72], and highlights the importance of culturing work alongside DNA sequencing and other culture-independent methods of investigation.
Cupriavidus was identified in the sequencing results, but at very low abundance: there was a maximum of 247 reads in one of the EP high chloride replicate samples, and the KH sample had only 4 Cupriavidus reads. These heterotrophic bacteria from the Burkholderiales order are resistant to heavy metals including copper, cadmium, and cobalt [80], and are often found in highly contaminated groundwater and soils. Closely related species are able to degrade a wide range of aromatic compounds including toluene, benzene, and dichlorophenol [81], and have been investigated as potential bioremediation agents [82, 83]. Impacts from saltwater intrusion may therefore also affect the resilience of an ecosystem to external contaminants.
| GW Sample | Sample ID | Original Condition | Gene Sequenced | Closest Relative | Accession Number | % Identity | Oxygen Preference | Energy Sources | References |
| AB | AB1.1 | Control | 16S rRNA | Pseudomonas fluorescens | KY172955 | 99.9 | F | Sugars, organic acids. Partial denitrifier. | [73] |
| EEG | EEG1.1 | Control | 16S rRNA | Pseudomonas veronii | NR028706 | 99.5 | F | Nitrate, sugars, organic acids, aromatic compounds. | [74] |
| EP | EP2.1 | Control | 16S rRNA | Pseudomonas fluorescens | KY172955 | 99.8 | F | Sugars, organic acids. Partial denitrifier. | [73] |
| EP | EP2.2 | High | 16S rRNA | Klebsiella oxytoca | AY601679 | 98.8 | F | Nitrate, sugars, sugar alcohols, N2-fixation. | [56] |
| KH | KH1.2 | Control | 16S rRNA | Cupriavidus basilensis | CP010536 | 98.8 | A | Organic acids, aromatic compounds. | [75] |
| KH | KH1.7 | Control | 16S rRNA | Pseudomonas veronii | NR028706 | 100 | F | Nitrate, sugars, organic acids, aromatic compounds. | [74] |
| KN | KN2.1 | Control | 16S rRNA | Pseudomonas veronii | NR028706 | 99.4 | F | Nitrate, sugars, organic acids, aromatic compounds. | [74] |
| LA | LA2.1 | Control | 16S rRNA | Pseudomonas veronii | FM162562 | 98.7 | F | Nitrate, sugars, organic acids, aromatic compounds. | [74] |
| NEG | NEG1.2 | Control | 16S rRNA | Pseudomonas veronii | CP018420 | 99.6 | F | Nitrate, sugars, organic acids, aromatic compounds. | [74] |
| NTG | NTG1.1 | High | 16S rRNA | Klebsiella michiganensis | CP061930 | 99.4 | F | Nitrate, sugars. | [76] |
| NTG | NTG1.3 | High | 16SrRNA | Klebsiella pasteurii | MN104671 | 99.9 | F | Nitrate, sugars. | [77] |
| NTG | NTG1.5 | Control | nosZ | Sinorhizobium fredii | CP003563 | 91.8 | A | N2-fixation, peptides, sugar alcohols. | [47] |
| NTG | NTG1.6 | Control | 16S rRNA | Pseudomonas fluorescens | EU003535 | 99.2 | F | Sugars, organic acids. Partial denitrifier. | [73] |
| OM | OM1.1 | Control | 16s rRNA | Pseudomonas putida | AY918067 | 96.4 | F | Sugars, aromatic compounds. | [78] |
| OM | OM1.2 | Control | 16S rRNA | Pseudomonas veronii | NR028706 | 99.9 | F | Nitrate, sugars, aromatic compounds. | [74] |
| OM | OM3.1 | Control | 16S rRNA | Azospira sp. I09 | LC097210 | 99.9 | µ | N2-fixation, organic acids, ethanol. | [59] |
| WA | WA2.1 | Control | 16S rRNA | Pseudomonas fluorescens | KY172955 | 99.0 | F | Sugars, organic acids. Partial denitrifier. | [73] |
| WA | WA2.2 | Control | 16S rRNA | Microvirgula aerodenitrificans | AJ487013 | 98.8 | A | Nitrate, organic acids, alcohols. | [79] |
| WA | WA2.3 | Control | 16S rRNA | Pseudomonas sp. | CP049045 | 98.3 | F | n.d. | - |
CONCLUSION
This study demonstrated the effects of increasing chloride concentrations on microbial groundwater communities. Each groundwater sample responded slightly differently to chloride, depending on the microbial communities present. Most of the samples did not show significant changes in OD600 in the presence of chloride. The EP sample showed a modest decline only in response to high chloride, while other populations were stimulated by the presence of chloride (e.g. NTG, AB, OM samples).
DNA sequencing indicated that 11 genera showed substantial differences between the control and high chloride conditions. It was notable that bacteria reliant on the nitrogen cycle for energy generally declined in abundance, such as denitrifying Pseudomonas and ammonia-oxidising Nitrosospira. Heterotrophic bacteria able to use sugars or peptides for energy, including Alteromonas and Brevundimonas, often increased in abundance under high chloride conditions, although this was sample specific. Classification of the DNA sequences to species level showed that 34 species showed substantial differences in abundance. These included Pseudomonas, Brevundimonas, and Alteromonas species, as identified at the genus level, as well as a decline in the human pathogens Salmonella enterica and Escherichia coli.
Interactions between bacterial ecological functions were predicted through network analysis. For example, the decrease in abundance of Nitrosospira may be in part due to the reduced viability of bacteria producing ammonia, such as A. oryzae, L. hongkongensis or the DNRA bacteria Salmonella enterica. Similarly, lower numbers of reads classified as the salt-tolerant Fe(III) reducer Albidiferax ferrireducens are potentially caused by a concomitant decline in the Fe(II) oxidiser Sideroxydans lithotrophicus.
Bacterial culture enabled the identification of 19 species from either control or high chloride conditions. Removal of the dominant but salt-sensitive Pseudomonas species allowed for a greater diversity of bacteria to be cultured, including those seen at low abundance in sequencing results.
This study confirms the importance of combining DNA sequencing with laboratory culture to identify keystone species and the potential effects of saltwater intrusion on ecological functions. In particular, we note that sequencing 16S rRNA gene amplicons did not reflect all strains able to be cultivated in the laboratory. Future work will target specific coastal aquifers to allow management decisions to prioritise which groundwater ecosystems should be protected from sea level rise or over-abstraction in the future.
LIST OF ABBREVIATIONS
| BSA | = Bovine Serum Albumin |
| DNRA | = Dissimilatory Nitrate Reduction to Ammonium |
| ESR | = Institute of Environmental Science and Research |
| GN | = Giltray Nitrate Culture Medium |
| OD600 | = Optical Density measured at 600 nm |
| OTU | = Operational Taxonomic Unit |
| PCR | = Polymerase Chain Reaction |
ETHICS APPROVAL AND CONSENT TO PARTICIPATE
Not applicable.
HUMAN AND ANIMAL RIGHTS
Not applicable.
CONSENT FOR PUBLICATION
Not applicable.
AVAILABILITY OF DATA AND MATERIALS
The OTU table for all 16S rRNA gene sequences is available at Zenodo: https://doi.org/10.5281/zenodo.6029769.
FUNDING
This project was supported by the New Zealand Ministry of Business, Innovation, and Employment (MBIE) through the Global Change Through Time (GCT) programme (Strategic Science Investment Fund, contract C05X1702).
ACKNOWLEDGEMENTS
The authors gratefully acknowledge Sajeewa Herath, Waikato Regional Council, and Phillip Abraham, ESR, for assistance with sample collection.
SUPPLEMENTARY MATERIALS
Supplementary material is available on the Publisher’s website.