All published articles of this journal are available on ScienceDirect.

Novel Microbial Signatures in the Faecal Microbiome Associated with Severe Alcoholic Hepatitis: Bacteroides Finegoldii and Veillonella Dispar
Authors Info & Affiliations
Abstract
Background:
Alcoholic hepatitis is associated with dysbiosis, resulting in compositional changes in the gut microbiome, endotoxin transfer to the portal vein, and activation of inflammatory signalling pathways in the liver. However, the microbiome signature of severe alcoholic hepatitis (AH) patients of Indian origin is unknown.
Aim:
To investigate the microbiome diversity of Indian AH patients in comparison to non-alcoholic healthy controls (HC).
Methods:
16S rRNA amplicon-based metagenomics analysis of faecal samples at the time of AH diagnosis (n=12) was compared with HC (n=6), and correlation with survival status, co-occurrence networking, Linear Discriminant Analysis Effect Size (LEfSe), and the relationship between diet – microbiome were performed.
Results:
16S rDNA data showed a significant abundance of the Enterobacteriaceae family belonging to the phylum Proteobacteria and a depletion of the phylum Firmicutes in AH. A species-level classification identified Klebsiella pneumonia, Klebsiella variicola, and Parabacteroides distasonis as having the highest predictive performance value with reference to mortality at 60 days. Apart from this, a unique finding was the abundance of Bacteroides finegoldii and Veillonella dispar in AH patients. Moreover, the co-occurrence networking analysis revealed a higher level of connectivity and complexity within the microbial community of AH patients compared to HC. Thus, indicating the significant positive association (Spearman r > 0.7, p < 0.01) among members of the Firmicutes, Bacteroidetes, and Proteobacteria phyla in AH. Wilcoxon-Rank Sum test (p < 0.01) identified Firmicutes phyla occurrence associated with high carbohydrate intake and Actinobacteria phyla with low protein intake.
Conclusion:
The findings provide the baseline occurrence profile of the gut microbiome signature of liver damage and the diet-microbiome relationship in patients with severe AH. The study demonstrated an abundance of Proteobacteria phyla, indicating their role in inflammatory conditions, and further identified Bacteroides finegoldii and Veillonella dispar in severe AH patients. Additionally, Klebsiella pneumonia, Klebsiella variicola, and Parabacteroides distasonis were identified as mortality-predictive risk biomarkers.
1. INTRODUCTION
Long-term alcohol abuse exerts a spectrum of potent effects on different body systems, ranging from psychiatric symptoms, malnutrition, and chronic pancreatitis to alcoholic liver disease, hepatocellular carcinoma, and cardiovascular disease. Alcohol modulates the human gut microbiota through the leaky intestinal barrier via the translocation of viable bacteria and their products to the liver [1]. One of the proposed mechanisms is the direct impact of the expression of pathogendamage-associated molecular patterns, toll-like receptor 4 (TLR4), and NOD-like receptors (NLRs) [2-4]. More recently, Lang et al. (2020) observed altered intestinal microbial overgrowth and dysbiosis in patients with chronic alcohol consumption, which led to increased mortality risk [5]. So, maintenance of eubiosis and stabilizing the mucosal gut barrier may prevent liver damage progression. However, alcohol consumption-mediated microbiota patterns are unknown.
Studies by Mutlu and colleagues (2009) showed that rats fed continuously with ethanol for ten weeks caused dysbiosis of the mucosa-associated microbiome, indicating that the microbiota's composition is crucial in alcoholic liver disease (ALD) [6]. Furthermore, the same team studied gut micro-biome alteration in human subjects (2012). Through PCR fingerprinting and pyrosequencing using 16s RNA primers, they examined the mucosa-associated colonic microbiome in 48 alcoholics, both with and without alcoholic liver disease (ALD). Their findings suggested an increased abundance of Proteobacteria in comparison to Bacteriodates, correlating with decreased microbial networking [7]. Yan et al. (2011) reported a similar finding of an increased ratio of Proteobacteria and a reduction in Bacteroides and Lactobacillus species [8]. A lower representation of the Lachnospiraceae and Ruminococcaceae families was reported in ALD [9].
Another altering factor is the diet, which can rapidly affect the community structure and functional potentials of gut microbiota [10], yet there is limited clarity on the types and/or patterns of the microbiome. A study by Graf et al. (2015) showed that the influence of short-/long-term diet effects, and gut microbiota composition were crucial factors along with inter- and intra-individual variability [11]. Indian diet is mainly composed of whole grains and plant-based products, which overall included high calorie and low protein intakes [12]. An extensive Indian study carried out by Dhakan et al. (2019), using 16S rRNA gene amplicon sequencing, whole-genome shotgun metagenomic sequencing, and metabolomics profiling, identified the gut microbiome composition among Central (Madhya Pradesh) and South (Kerala) Indians. This multiomics study identified 943,395 genes unique to the Indian gut microbiome, with Prevotella as the most dominant genus. Prevotella plays a critical role in the enrichment of branched-chain amino acid (BCAA) and lipopolysaccharide (LPS) biosynthesis pathways [13].
The present study, for the first time to our knowledge, has investigated the microbiota signature of AH patients in comparison to healthy non-alcoholic individuals in a tertiary care hospital based in New Delhi, India, using the amplicon-based metagenomics analysis of faecal samples. Concurrently, we carried out a multifactor statistical analysis of metagenomics data, including their effect on the composition of the diet.
2. MATERIALS AND METHODS
2.1. Subject Recruitment and Faecal Sample Collection
Patients diagnosed with alcoholic hepatitis and those who were admitted to the hospital (in-patient; n=12), aged 30 to 66 years were enrolled in the study. AH was defined and staged as per Maddrey discriminant function (DF) ≥32, having portal vein hypertension and a MELD score of 27 (ranging from 24.3 - 31) with a history of alcohol abuse at least for the last 10 years. At the time of enrolment, patients were not on antibiotics for the last 7 days. AH patients positive for Hepatitis C virus (HCV), Hepatitis B virus (HBV), autoimmune diseases, those under 18 years of age, cancer or systemic diseases, hepatic cyst, those with hepatitis B surface antigen (HBsAg) positive were excluded. Faecal samples were taken within 24 hours post-admission.
The control healthy group included HC (n = 6) with no history of the disease at the time of enrolment, had normal clinical indices, and was not on antibiotics in the previous three months. Geographically, the patients and the controls shared a comparable standard of living as well as a similar socioeconomic background [Delhi National Capital Region (NCR)]. The duration of the study period was from June 2021 to July 2022. The Ethics Committee of Sir Ganga Ram Hospital, India (registered under the Drugs Controller General of India; ECR/20/Inst/DL/2013/RR-19), has approved the study (EC/06/19/1547) and informed written consent was obtained from those who voluntarily agreed to participate.
Routine dietary intake was noted, and their nutritional value was calculated in grams and energy in Kcal, based on ICMR criteria (ICMR, 2011; https://www.nin.res.in/ downloads/DietaryGuidelinesforNINwebsite.pdf) [14]. Patients were segregated based on these nutritional factors into three groups: protein, carbohydrate, fat- high or low intake.
2.2. Sample Collection and DNA Isolation
Fresh solid faecal samples (about 250 mg) were collected in sterile collection containers and stored at -80°C in glycerol 1/1 (weight/volume). The total bacterial genomic DNA was isolated using the QiaAmp DNA Stool Mini Kit (Qiagen, Hilden, Germany) as per the manufacturer’s protocol. gDNA quality was confirmed by agarose gel electrophoresis and quantified using the Qubit dsDNA HS Assay Kit (ThermoFisher Scientific, USA) on the Qubit 2 instrument (ThermoFisher Scientific, USA).
2.3. Amplicon Library Generation and Sequencing
Hypervariable regions (V2-V9) of the 16S rRNA gene were PCR amplified using Ion 16S™ Metagenomics Kit (ThermoFisher Scientific, USA). In brief, 5 ng of gDNA were used for library preparation. The PCR reactions were performed with initial denaturation at 95°C/10 min, denaturation at 95°C/30 sec; annealing at 58°C/30 sec (18 cycles), and extension at 72°C/20 sec; extension at 72°C/7 min using a 9700 Thermocycler (ThermoFisher Scientific, USA). Amplicon libraries were purified using the AMPure XP reagent (Beckman Coulter, USA), quantified by the Qubit dsDNA HS Assay Kit, and verified on the Agilent 2100 Bioanalyzer (Agilent, USA) using the high-sensitivity DNA kit (Agilent, USA). Pooled equimolar concentrations (100 pM) of each library and further processed as described previously [15]. Sequencing was performed on the Ion S5 System using 400 base-read length chemistry in an 850 flow format.
2.4. Data Analysis and Statistics
The raw sequencing data were processed using Ion Reporter Software (V-5.12), and the data implemented a filtering step to remove low-copy reads (those detected in fewer than 10 copies) from the sequencing data. The remaining reads were then assigned to operational taxonomic units (OTUs) at a 97% similarity for genus and 99% similarity for species threshold using the curated MicroSEQ 16S Reference Library v2013.1 and the curated Greengenes v13.5 sequence database. This assignment was performed using the Ion Reporter 5.18 software, a cloud-based platform, following the recommended workflow and pipelines described in the Ion Reporter Metagenomics 16S algorithms overview (https://tools.thermofisher.com/content/sfs/brochures/ion-reporter-16s-metagenomics-algorithms-whitepaper.pdf). Additionally, to assess the alpha diversity metrics, we utilized an integrated QIIME pipeline within the Ion Reporter™ Software 5.18, as outlined in the QIIME2 documentation (https://qiime2.org). The alpha, and beta diversity were calculated according to the abundance-based coverage estimator, and significant differences were estimated using the R package “Bioconductor”. The Chao1 index (species abundance), Shannon and Simpson indices (species richness and evenness), and relative phyla abundance metrics were analyzed using the Paleontological Statistics Software Package (PAST). Beta diversity analysis was performed using UniFrac distance metrics and visualized via principal component analysis (PCoA) to investigate the structural variation of microbial communities. Statistically, a univariate frequency distribution was performed, and p values were obtained using the Mann-Whitney-U Test (Graph Pad Prism 9.3).
For clinical parameter analysis, p-values less than 0.05 were deemed statistically significant using SPSSv.28.0. The Receiver Operating Characteristic (ROC) curve illustrated the diagnostic ability of microbial species correlated with mortality risk in AH patients. The Kaplan-Meier test determined the total time (in days) from the confirmed diagnosis to the date of death.
DESeq2 analysis was performed to determine the differential expression pattern of species between AH and HC. Thereafter, taxon abundances at the levels of phylum, class, order, family, genus, and species were statistically compared among the groups. Heatmap of bacterial clusters generated using the normalized counts obtained from DESeq2 analysis, log-transformed, and Z-scaled using the package pheatmap in R (NG-CHM, GUI 2.20.2 BUILDER). The graphing package ggplot2 was used to plot these results. For the comparative diversity distribution of shared/unique OTUs at the species level, a Venn diagram was generated using Bioinformatics & Evolutionary Genomics. The volcano plot was derived from DESeq2 analysis using APEGLM.
The bacterial correlation network based on Spearman's rank analysis was performed with 100 permutations and represented at the genus level. OTUs with a prevalence of >10% and a frequency of >1% were used along with an inter-quantile filter for downstream analysis. Only strong correlations with Spearman's correlation coefficient r >0.07 or r <−0.70 at P-values <0.01 (Padjust, after correcting for false discovery) were considered for constructing the network.
To identify the most differential taxa associated with components of the diet (carbohydrates, proteins, and fat), the Linear discriminant analysis (LDA) effect size (LEfSe) algorithm (Wilcoxon rank-sum test, p<0.05) and KEGG pathway contributions of predicted metagenomics data [16] were used.
3. RESULTS
3.1. Clinical Findings
Demographic and clinical parameters of AH patients (n=12) and HC (n=6) are shown in Table 1. In addition, AH patients clinically had symptoms of scleral icterus, jaundice, and tender hepatomegaly, mostly with ascites (eleven out of twelve).
| Characteristics | Patients (n=12) | Controls (n=6) | P-value |
|---|---|---|---|
| - | Median (IQR) | ||
| Age (years) | 41 (35.5 - 50.5) | 32 (29 - 37) | 0.017* |
| Gender | Male (12/12) | Male (6/6) | - |
| Ascites | 11/12 | - | - |
| MELD | 27 (24.3 - 31) | - | - |
| mDF | 56.35 (43.1 - 72.18) | - | - |
| Mortality | 8/12 | - | - |
| Laboratory Parameters (Normal range) | |||
| Hemoglobin (13 – 17 gm/dl) | 9.25 (8.75 - 10.82) | 14.5 (13.5 - 15.25) | 0.001** |
| TLC (4 - 10 thous/µl) | 11.82 (8.52 - 16.41) | 8.6 (7.45 - 9.6) | 0.061 |
| Prothrombin Time (11-13sec) | 20.4 (18.25 - 24) | 12 (11 - 13.5) | 0.001** |
| INR (1-1.5) | 2.28 (1.65 - 2.68) | 1.15 (1 - 1.35) | 0.001** |
| Platelet (150 - 450 thous/µl) | 190 (120 - 237.75) | 220 (184.75 - 294.25) | 0.24 |
| Blood Urea Nitrogen (8.9- 20.6 mg/dL) | 20.9 (12.07 - 37.79) | 12.35 (9.28 - 15.08) | 0.055 |
| Creatinine (0.7 - 1.25 mg/dL) | 0.83 (0.69 - 1.16) | 0.95 (0.88 - 1.13) | 0.261 |
| Calcium (8.4 - 10.2 mg/dL) | 8.2 (7.7. - 8.76) | 9.40 (8.80 - 10.13) | 0.007** |
| Phosphorus (2.3 - 4.7 mg/dL) | 3.4 (2.9 -4.1) | 3.50 (2.80 - 4.08) | 0.92 |
| Sodium (136 - 146 mmol/L) | 134 (130.0 - 140.0) | 139.5 (138.75 - 145.25) | 0.074 |
| Potassium (3.5 - 5.1 mmol/L) | 4.1 (3.61 -4.69) | 4.05 (3.75 - 4.83) | 0.92 |
| Total Bilirubin (0.20 - 1.20 mg/dL) | 15.58 (10.88-19.19) | 0.63 (0.23 - 0.99) | 0.001** |
| Direct Bilirubin (0 - 0.5 mg/dL) | 9.09 (6.19-15.46) | 0.27 (0.10 - 0.40) | 0.001** |
| Total Protein (6 - 8.3 gm/dL) | 6.8 (6.35-7.08) | 7 (6.73 - 7.43) | 0.24 |
| Albumin (3.50 - 5.20 gm/dL) | 2.66 (2.43-3.10) | 4.55 (3.88 - 4.95) | 0.001** |
| SGOT (5- 34 IU/L) | 119 (75.25 - 227.82) | 25.5 (16.25 - 30.25) | 0.001** |
3.2. Microbial Diversity, Abundance, and Distribution
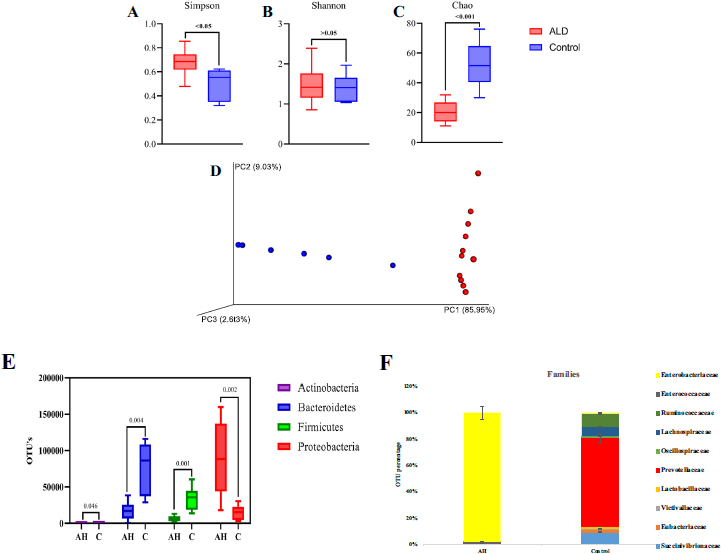
The diversity of microbial communities was determined by alpha-diversity analysis. AH patients showed a more diverse dominant species (p<0.05) than healthy controls, as calculated by the Simpson index that determines the highly abundant common or dominant species (Fig. 1A). Although higher species diversity existed in both AH and HC, no significant difference (p >0.05) was observed between the two (Shannon index; Fig. 1B). Fig. (1C), represented by the Chao index, observed significantly increased species abundance (p<0.001) among the HC. Beta diversity analysis represents the similarity or dissimilarity of microbial composition between groups. Euclidean PCoA plots (Fig. 1D) showed a shift in relative abundance from 9.03% (PC2, AH) to 85.95% (PC1; HC), denoting the low level of similarity among AH. This indicates the difference in the faecal microbiome of HC and AH patients.
The 16S rDNA data identified three major phylogenetic abundances, Firmicutes (13.4%), Bacteroidetes (29.2%), and Proteobacteria (56.2%), comprising 99% of total sequences. Chlamydiae, Cyanobacteria, Verrucomicrobia, Tenericutes, Nitrospinae, Synergistetes, Lentisphaerae, Actinobacteria, and Cyanobacteria accounted for 1% of the remaining sequences (Supplement Information; Fig. S1). Compared to HC, Proteobacteria were significantly abundant in AH (p=0.002), whereas Firmicutes (p=0.001), Bacteroidetes (p=0.004), and Actinobacteria (P=0.046) were observed to be significantly decreased in AH patients (Fig. 1E).
Fifty-eight microbial families were identified, of which 40 families were significant, as identified by DESeq2 (p≤0.005). After a mean cut-off of ≥100 OTU, Enterobacteriaceae was dominantly observed in AH; Prevotellaceae, Ruminococ- caceae, and Succinivibrionaceae were enriched in HC (Fig. 1F). Further, the DESeq2 data was represented as a Volcano plot, illustrating the quantitative pattern at species level between AH and HC (p<0.05) with a fold change of ≥2 (Fig. S2).
3.3. Differentially Enriched OTUs
The 143 species present in both AH and HC, represented in the Venn diagram (Fig. SI-3) showed 21 of 143 were common to both; thirty-six out of one hundred forty-three were distinct in AH patients, and the rest 85 were present in HC.
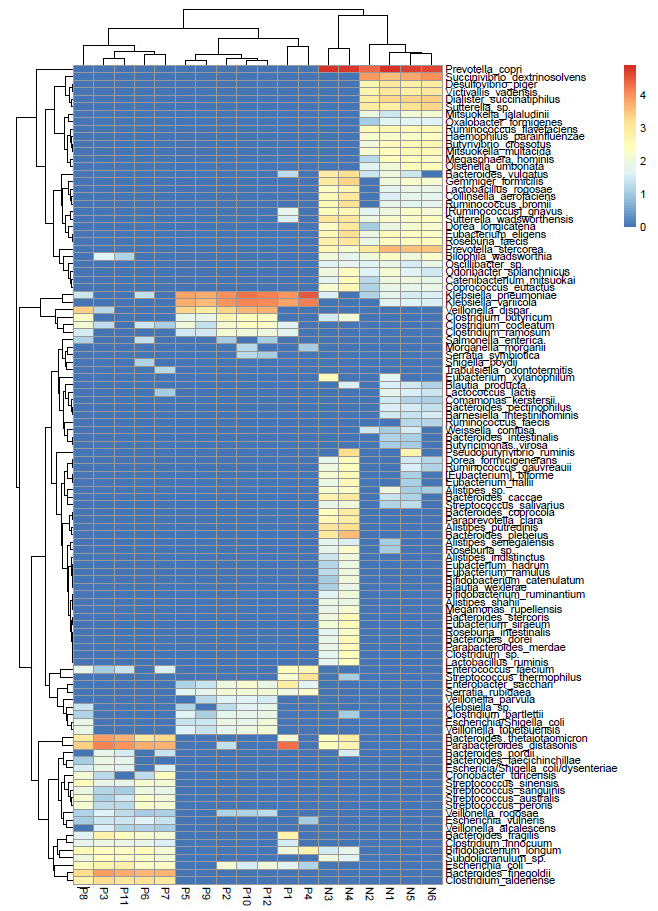
Using DESeq2 normalized data, we identified seven species significantly abundant in the AH group with a cut-off >500. These were Klebsiella pneumonia, Klebsiella variicola, Parabacteroides distasonis, Bacteroides finegoldii, Bacteroides thetaiotaomicron, Veillonella dispar, and Clostridium aldenense. On the other hand, Prevotella copri, Succinivibrio dextrinosolvens, Prevotella stercorea, Dialister succinatiphilus, Sutterella sp., Bacteroides plebeius, Gemmiger formicilis, Victivallis vadensis, and Desulfovibrio piger were significantly abundant in HC and non-detectable in AH (Table 2).
Furthermore, the DESeq2 data comprising of significant (p<0.05) OTUs was log normalized logarithmically and represented as a Heatmap (Fig. 2). The analysis showed differential species abundance in AH and HC, where enrichment of K.pneumoniae, K.variicola, B. thetaiotaomicron, and P.distasonis was found in AH, and P. copri, S. dextrinosolvens, and P. stercorea were found in HC. P. distasonis is a reference type of strain for the species Parabacteriodes (ATCC 8503). Reduction in Lactobacillus species was noted among AH (Table S1).
3.4. Microbiota at the Species Level Correlates With Mortality Predictive Risk Stratification
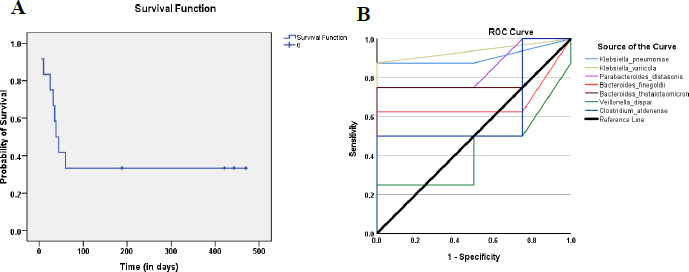
Kaplan–Meier analysis showed 66% (8/12) of AH patients died within 60 days of diagnosis (Fig. 3A). To determine the mortality predictive performance of the seven abundant species identified earlier in AH patients (Table 2), the area under ROC curves (AUCs) from logistic regression analysis, was used. Fig. (3B) indicates K. variicola, K. pneumonia, and P. distasonis could serve as a predictor for survival [AUC=0.938, 0.906 and 0.844 respectively; sensitivity = 1.00, 0.875 and 0.750 respectively] (Table S2).
| Species | AH (Mean ± SD) | HC (Mean ± SD) | p-value |
|---|---|---|---|
| Klebsiella pneumoniae | 8669.08 ± 10783.87 | 31.5 ± 22.16 | 9.13E-11 |
| Klebsiella variicola | 5706.83 ± 6001.46 | 23.34 ± 26.28 | 7.90E-09 |
| Parabacteroides distasonis | 4898.92 ± 6909.72 | 147.5 ± 238.04 | 1.61E-05 |
| Bacteroides finegoldii | 2133.92 ± 2989.83 | ND | 3.50E-12 |
| Veillonella dispar | 1466 ± 1892.91 | ND | 7.90E-13 |
| Bacteroides thetaiotaomicron | 1377.09 ± 2428.69 | 183.34 ± 326.7 | 0.002605 |
| Clostridium aldenense | 506.25 ± 690 | ND | 9.13E-11 |
| Prevotella copri | ND | 59941.34 ± 21661.94 | 3.37E-135 |
| Succinivibrio dextrinosolvens | ND | 5113.84 ± 4761.5 | 2.92E-21 |
| Prevotella stercorea | ND | 2146.84 ± 1798.9 | 1.60E-26 |
| Dialister succinatiphilus | ND | 1312.5 ± 1183.09 | 2.83E-18 |
| Sutterella sp. | ND | 907 ± 881.08 | 6.32E-18 |
| Bacteroides plebeius | ND | 860 ± 1644.40 | 1.1E-10 |
| Gemmiger formicilis | ND | 621.5 ± 903.34 | 1.32E-17 |
| Victivallis vadensis | ND | 590.67 ± 507.6 | 3.26E-17 |
| Desulfovibrio piger | ND | 512.34 ± 446.23 | 9.28E-17 |
3.5. Correlation Network Microbiome
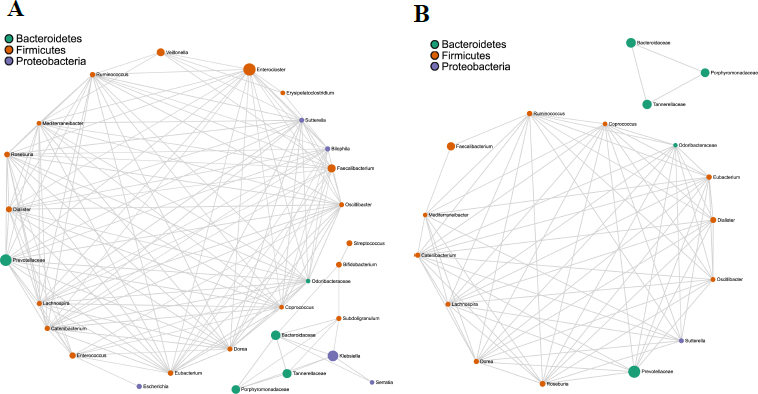
Bacterial co-occurrence network analysis using Spearman's correlation values is a well-tested and utilized method to study the interaction between different bacterial members in a community. A total of 166 and 75 strong correlations/edges were found in AH and HC, respectively. In AH, 130 positive and 36 negative correlations/edges were noted (Fig. 4A), whereas no negative correlation was recovered in HC (Fig. 4B). In both groups, the co-occurring genera belonged to three phyla - Bacteroidetes, Firmicutes, and Proteobacteria (gamma- and beta-Proteobacteria). Among these, the phylum Firmicutes was dominant, indicating its key position in the hub taxa (Fig. S4). In AH, 146/166 (89%) edges had either one or more Firmicutes members with high centrality scores. In HC, 70/75 (93%) edges were associated with at least one of the nodes corresponding to Firmicutes phyla. The direction of the correlation (positive and negative), the exact number of edges, and correlation values are shown in Tables S3 and S4.
3.6. Microbiota Composition according to Dietary Nutrient Intakes
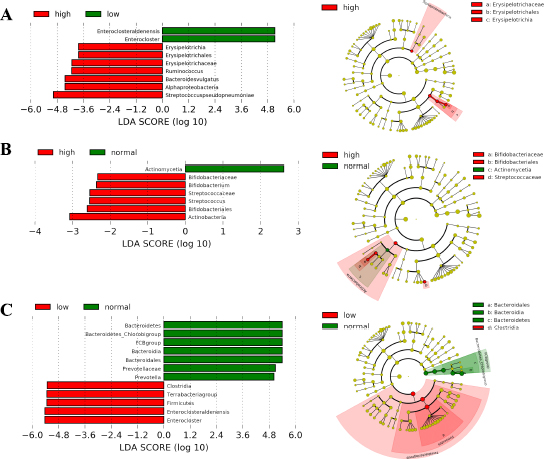
Distinct microbiome taxa were detected among AH with either low and/or high intake of carbohydrates, proteins, and fat, based on LEfSe analysis (Table S5). Fig. (5A) depicts a significant increase in the number of Bacteroides vulgatus/ Firmicutes phylum (p=0.04) and Erysipelotrichales/ Bacillota phylum (p=0.04) among those who had a high intake of carbohydrates. Most of the AH patients showed a low intake of protein diet. Actinobacteria phylum was predominant with a significant abundance of Streptococcus and Bifidobacterium at the genus level (p-value ranging from 0.0019 – 0.042; Fig. 5B). AH patients whose fat intake was low, showed a significantly decreased abundance of Terrabacteria group (p≤ 0.0007; Fig. 5C), but FCB group (Fibrobacterota, Chlorobiota, and Bacteriodota member phyla) was found to be at a normal level. A detailed diet chart and intake by participants along with statistical evaluation has been included as Table SI-6 (A) and (B).
4. DISCUSSION
Alcohol-specific gut microbiome signatures of Indian AH patients showed a differential signature compared to those of normal healthy individuals. By performing the bacterial co-occurrence network analysis, major hub interactions were identified, and further, a differential microbial pattern was delineated based on dietary components. Although the literature cites studies on faecal microbiome profiling in AH patients, the gut microbiota composition of Indian ethnic groups is lacking. Demographically, alcoholic hepatitis patients enrolled in the present study exhibited leucocytosis, thrombocytopenia, and hyper bilirubinaemia. An increase in mortality rate was observed due to septicaemia, a commonly observed syndrome among AH patients. Similar demographics were observed in other studies [16-20].
4.1. Microbial Signature
A significantly decreased alpha diversity (Shannon index/PCoA) was observed in AH patients, correlating with the disease stage. An abundance of Proteobacteria, especially the Enterobacteriaceae family, and lower numbers of Firmicutes in AH patients compared to an increased abundance of Bacteroidetes / Prevotellaceae family in HC, providing evidence to link bacterial translocation in severe hepatitis. Earlier studies in both alcohol-ingested mouse models and human subjects (ALD patients) concurred with a significantly increased Proteobacteria phylum [6]. Increased Enterobac-teriaceae and reduced Bacteroidetes, Lactobacillus, and Actinobacteria were seen in patients with ALD and other chronic liver diseases [21]. A study carried out by Llopis et al. (2016) observed that severe AH patients harbour abundant Bifidobacteria and Streptococci [22]. Abundances of Proteobacteria have been implicated in chronic Crohn's disease and ulcerative colitis [23, 24], thereby supporting their presence in intestinal dysbiosis.
Sub-classification analysis at the species level identified the top seven microbes as K. pneumonia, K. variicola (Proteobacteria phylum), P.distasonis, B. finegoldii, B. thetaiotaomicron (Bacteroidetes phylum), V. dispar, and C. aldenense (Firmicutes phylum) in AH patients. B. finegoldii and V. dispar have not been reported earlier in AH patients. The top 3 microbial species [K. pneumonia, K. variicola, and P. distasonis] showed the highest predictive performance with reference to mortality. This bacterial panel can be used as a mortality risk predictive biomarker. A study by Nakamoto et al. (2019) suggests K. pneumonia disrupts the intestinal barrier, resulting in permeability and liver inflammation that is mediated by Th17 cells in primary sclerosing cholangitis [25]. Other studies have also observed K. pneumonia to be associated with high morbidity/mortality in AH patients with immunocompromised conditions like sepsis [26-28]. Similarly, we observed a significant increase in K. variicola, a common multidrug-resistant species in ALD [29]. Very recently, Ezeji et al. (2021) found P.distasonis, a new species belonging to the Bacteroidetes phylum. The authors herein described the emerging role of this microbe in antimicrobial resistance, in inflammatory signalling cascades, resulting in the production of IL-1β activated by the HIF-1α pathway that attenuates T-regulatory cell development and favours IL-17 secretion [30].
Taxonomically, B. finegoldii and B. thetaiotaomicron belong to the Bacteroidales order. These species have been reported in inflammatory bowel disease (IBD) and colorectal cancer [31, 32]. Studies have also shown that B. finegoldii helps in host metabolism and B. thetaiotaomicron is involved in nutrient absorption, epithelial cell maturation, and maintenance [33, 34]. In our study, both of these bacteria were significantly abundant in patients, yet their role in AH is yet to be determined. Another unique species identified is V. dispar, found in AH patients. Studies have reported a relative abundance of Veillonella at the genus level to correlate with MELD score, serum bilirubin levels, and disease recurrence [5, 35-37].
A recent study by Prasoodanan et al. (2021) identified a high abundance of Prevotella copri among healthy individuals belonging to different geographical locations in India. This species plays a critical role in carbohydrate and fibre metabolism [38]. Similar data were observed in the HC group, whereas AH patients showed the absence or non-detectable levels of Prevotella copri, Succinivibrio dextrinosolvens, Prevotella stercorea, and Dialister succinatiphilus.
The correlation network analysis revealed strong interconnections between Firmicutes, Bacteroidetes, and Proteobacteria genera, indicating an imbalanced microbiome in AH. Enterocloster (Bacillota phyla), Prevotellaceae (Bacteroidota phyla), and Klebsiella (Proteobacteria phyla) were identified as key taxa in the network, similar to findings in NAFLD patients [39].
4.2. Diet and Microbiome
Dietary components are major factors that influence the gut microbiota both in healthy and diseased conditions. The three major macromolecules, fats, carbohydrates, and proteins, stimulate responses that modulate gut microbial diversity [18]. In the present study using LEfSe analysis, we found distinct taxa based on a higher or lower intake of macronutrients. AH patients with a high-carbohydrate rich diet showed significantly increased Bacteroides vulgatus/Firmicutes phylum and Erysipelotrichales/ Bacillota phylum; Actinobacteria phyla were predominantly associated with low-protein intake; patients with low-fat intake showed a significantly decreased abundance of Terrabacteria group, although the FCB group (Fibrobacterota, Chlorobiota, and Bacteriodota member phyla) was found to be at a normal level. Murphy et al. (2010) observed increased Firmicutes when mice were fed a high-fat diet [40]. Contrary to our data, studies have shown increased levels of Bifidobacteria in the faecal excretion of rats fed with high protein [41, 42]. In a study conducted by Nakayama et al. (2015), a comparison of faecal microbiota was carried out among 303 school-going children from Central Asian and Southeast Asian regions. The findings suggested that dietary factors may influence the abundance pattern of the Bacteroides and/or Prevotella genus [43]. Thus, diet-related microbial diversity can reflect changes in the gut microbiota structure and composition based on nutritional factors.
Studies have reported that the utilization of probiotics and prebiotics has been associated with clinical improvement in patients with alcoholic liver disease [44-46]. However, a comprehensive correlation between the gut microbial pattern and the composition of the diet is not well studied. Interestingly, a significant abundance of Bifidobacterium, a probiotic, was found among those who had a high-protein diet. Studies have reported, a shift in the relative abundance of Bifidobacterium in relation to dietary nutrients among AH patients [47-49]. Thus, suggesting increasing numbers of Bifidobacterium in AH patients could potentially mitigate liver damage and inflammation. While one cannot completely rule out the possibility that some of these taxa, could be transient food-associated microbes, there is a growing body of evidence suggesting that levels of Bifidobacterium can increase in pathologies like AH [50]. Yet the possibility of exploring the use of pre-/probiotic as an intervention for AH or Faecal Microbiota Transplantation in AH could be tailored for a better prognosis [51].
Keeping in view the lack of evidence on gut-liver microbiota profiling in alcoholic hepatitis patients of a particular geographical location and its effect on Indian diet preferences, a strict exclusion criteria enabled only a limited number of patients to be enrolled during the study period. This preliminary study provides the foundation for further research in this field, and an in-depth understanding of their effects can lead to the development of newer medicinal options for alcohol-related liver diseases.
CONCLUSION
Consequences of chronic alcohol use cause overgrowth and/or altered taxonomic intestinal microbiomes, thus resulting in gut dysbiosis. Our findings observed that intestinal dysbiosis in AH harbours mainly Proteobacteria phyla, Klebsiella pneumonia, Klebsiella variicola, and Parabacteroides distasonis can serve as predictors for survival. In addition, two novel species, Bacteroides finegoldii, and Veillonella dispar, could be used as potential diagnostic biomarkers of severe AH. Although studies have reported the effect of food and epigenetic factors on the composition of the microbiome in healthy and disease conditions, to date their interactive microbial mechanistic remains equivocal, thus necessitating further studies. Taken together, our findings illustrate the importance of the relationship between interacting microbes and their regulation based on disease status and/or alcohol composition.
AUTHORS' CONTRIBUTIONS
The manuscript was written through the contributions of all authors. All authors have approved the final version of the manuscript. RH performed a collection of human samples/isolation/NGS assays, and analysis and framed the manuscript. AK conceptualized, and enrolled patients as per inclusion criteria, provided detailed demographics, and edited the manuscript. RR performed data analysis using the 'R' package. SB, SNP, and DP guided and framed the manuscript. AA and PS helped with clinical work details and proofreading. SC conceptualized, guided, analyzed the data, framed, and edited the manuscript.
ETHICS APPROVAL AND CONSENT TO PARTICIPATE
The study was reviewed and approved by Sir Ganga Ram Hospital Ethics Committee (Ethics approval code: EC/06/19/1547). The patients/participants provided their informed consent to participate in the study.
HUMAN AND ANIMAL RIGHTS
No animals were used in the research. The reported experiments were carried out as per the Helsinki Declaration of 1975, as revised in 2013.
CONSENT FOR PUBLICATION
Informed written consent was obtained from those who voluntarily agreed to participate.
STANDARDS OF REPORTING
STROBE guidelines were followed.
AVAILABILITY OF DATA AND MATERIAL
The data and supportive information are available within the article.
FUNDING
This study was funded by Research and Development program, Sir Ganga Ram Hospital, Delhi, India (Grant number: 4.9.36 – 012).
CONFLICT OF INTEREST
The authors declare that the research was conducted in the absence of any commercial or financial relationships that could be construed as a potential conflict of interest.
ACKNOWLEDGEMENTS
The authors would like to thank Chayan Roy, Post-Doctoral Fellow, for performing co-occurrence/ LEfSe analysis; Parul Chugh, Biostatistician for statistical analysis.
SUPPLEMENTARY MATERIAL
Supplementary material is available on the publisher’s website along with the published article.