All published articles of this journal are available on ScienceDirect.

Correlation Between Heat Resistance and Biofilm Formation of Bacillus Strains' Spores Isolated From Raw Cow's Milk
Authors Info & Affiliations
Abstract
Introduction
Bacillus spp. pose a critical challenge to the dairy industry due to their ability to form highly heat-resistant endospores and robust biofilms on processing surfaces, leading to recontamination and food safety risks. This study aimed to investigate the correlation between the heat resistance of spores and the biofilm formation capacity of seven Bacillus strains isolated from raw cow's milk in the Mekong Delta, Vietnam.
Methods
Thermal resistance (D-values) was determined by treating spores at 80, 85, 90, and 95 °C for intervals of 12, 15, 20, 25, and 30 minutes. Biofilm formation was quantified using the crystal violet assay in 96-well plates via OD570 measurements. Additionally, phylogenetic relationships were elucidated through 16S rRNA gene sequencing and compared with GenBank sequences to identify the isolates.
Results
A significant positive correlation was observed between biofilm density and spore heat resistance, with an R-squared (R2) value of = 0.881 (p = 0.00174). Strains with higher OD570 values exhibited significantly greater D95 values. Notably, strain TGS11.1 showed the highest thermal resistance (D95 = 11.37 minutes) and the strongest biofilm-forming ability (OD570 = 0.3196). Phylogenetic analysis indicated a high degree of genetic similarity between these isolates and Bacillus cereus.
Discussion
These findings reveal a “double risk” from indigenous Bacillus spp. strains, where the ability to persist via biofilms and survive thermal processing through resistant spores occurs simultaneously. This synergy complicates sterilization protocols and suggests that biofilm-forming capacity could potentially serve as an indicator for thermal persistence in dairy processing environments.
Conclusion
The study highlights a clear link between biofilm formation and spore heat resistance in Bacillus spp. These results underscore the necessity for more stringent interventions and offer practical guidance for optimizing sterilization practices to ensure the safety of dairy products.
1. INTRODUCTION
The dairy industry plays a vital role in global agricultural economies and nutritional security. However, maintaining commercial sterility and sensory quality of milk products remains a major challenge due to contamination by Bacillus spp. strains, a group of bacteria capable of forming heat-resistant endospores and biofilms on the surfaces of processing equipment [1]. A recent systematic review reported a global prevalence of this Gram-positive genus in milk and dairy products of 11.8%, with the highest rate in Asia (15.4%) [2]. Their spores can survive thermal treatments due to multilayered structures; under favorable conditions, spores germinate, regenerate into vegetative cells, and proliferate, leading to product spoilage and food safety risks [3, 4]. The microbiological hazard is further exacerbated when these bacteria adhere to stainless steel pipelines or tanks and form complex biofilms, creating persistent reservoirs of recontamination that are difficult to eliminate with conventional cleaning procedures [5]. Although their importance has been recognized, most studies have evaluated heat resistance and biofilm formation as separate physiological traits [6]. Other investigations have highlighted the protective role of biofilm against environmental stresses, including high temperature, disinfectants, and oxidative stress [7-9]. The microbiological risk in dairy plants increases substantially when Bacillus spp. strains adhere and develop biofilms within stainless steel processing systems. Biofilm not only serves as a reservoir for recontamination but also functions as a protective shield, enabling spores to resist adverse factors such as cleaning chemicals and thermal stress [10]. Nevertheless, experimental studies that simultaneously assess and establish a direct correlation between thermal resistance (DT value) and biofilm formation in the same bacterial strain remain limited. In particular, convincing evidence is still lacking to confirm whether the most heat-resistant strains are also the strongest biofilm formers under identical conditions [11]. Therefore, evaluating the correlation between heat resistance and biofilm formation in Bacillus spp. is not only academically relevant but also critical for food safety risk assessment and the development of effective control strategies in the dairy industry. In Vietnam, especially in the Mekong Delta region, data on this relationship in indigenous Bacillus strains isolated from raw milk remain scarce, representing a knowledge gap that needs to be addressed to optimize Cleaning-in-Place (CIP) procedures. This study was conducted to determine the correlation between heat resistance ability and biofilm spore-forming ability of seven Bacillus spp. strains isolated from raw cow’s milk in the Mekong Delta. To achieve this objective, DT values of spores were determined at four temperature levels (80, 85, 90, and 95°C). In parallel, biofilm formation was quantitatively assessed using the Crystal Violet staining method (OD570 measurement). The correlation between biofilm formation and spore heat resistance (represented by D95 values) was analyzed using linear regression modeling. In addition, genetic relationships and strain identification were clarified through 16S rRNA gene sequencing. The findings of this study not only contribute to academic understanding of bacterial adaptation mechanisms but also provide practical evidence for establishing more effective Critical Control Points (CCPs), thereby enhancing food safety standards in the Vietnamese dairy industry.
2. MATERIALS AND METHODS
2.1. Sample Collection
Six raw cow’s milk samples were collected in the morning between 7:00 and 9:00 a.m. from dairy farms located in several provinces of the Mekong Delta, Vietnam. Each sample was randomly obtained in sterile plastic containers, kept under refrigeration, and transported to the laboratory within a maximum of 4 hours. Upon arrival, samples were stored at 4 °C until bacterial isolation was performed.
2.2. Isolation and Identification of Bacterial Strains
A 150 mL aliquot of raw milk was heat-treated at 80 °C for 12 min in a thermostatic water bath to eliminate vegetative cells, followed by immediate cooling in an ice-water bath [12]. Subsequently, the bacterial isolation procedure was assessed following the method of a study [13], with modifications: 1 mL of diluted sample was spread-plated onto Luria Bertani (LB) agar medium (10 g/L Peptone, 5 g/L Yeast extract, 10 g/L NaCl, 20 g/L Agar) and incubated at 37 °C for 24 h. Colonies were observed, and pure cultures were obtained by repeated streaking. Isolated strains were preserved in LB–glycerol (1:1) at −80 °C for subsequent experiments.
2.3. 16S rRNA-based Bacterial Identification
Pure bacterial isolates were subjected to Gram staining, motility testing, and catalase reaction following the guidelines of Bergey’s Manual of Systematic Bacteriology [14]. Gram-positive, motile, and catalase-positive strains were selected for 16S rRNA gene sequencing to identify target species. The primer pair used for amplification was 27F (5′–AGAGTTTGATCCTGGC TCAG–3′) and 1492R (3′–CGGTTACCTTGTTACGACTT–5′). The resulting 16S rRNA sequences were compared with available sequences in the NCBI GenBank database using the BLAST online tool (https://blast.ncbi.nlm.nih.gov). Based on BLAST results, phylogenetic trees were constructed, and scientific nomenclature of the isolates was determined.
2.4. Assessment of Thermal Tolerance of Bacterial Spores
Spores of target strains were produced by incubating cultures in 1% (w/v) peptone solution at 37 °C for 14 days, followed by heat treatment at 80 °C for 10 min to eliminate vegetative cells. Spore suspensions were stored at 4 °C until use. Thermal inactivation was performed according to the method described by Lin et al. (2022) [15], with modifications: 2.5 mL of spore suspension was exposed to 80, 85, 90, or 95 °C in a water bath for 12–30 min, then rapidly cooled in ice. Surviving spores were quantified by plating 1.0 mL of heated suspension on LB agar, incubating at 37 °C for 48 h, and enumerating CFU using the plate count method on PCA. Mean values were calculated from three independent replicates.
2.5. D-value Calculation
The heat resistance of each strain was assessed by determining the DT value (min), calculated from the number of surviving spores after thermal treatment using the following formula:
 Where: + DT: Decimal reduction time at temperature T. + N: The number of microorganisms in the product at time t (CFU/mL) + N0: The initial number of microorganisms (CFU/mL) + t: Heating time (minutes).
2.6. Quantitative Biofilm Formation
The biofilm-forming ability of bacterial strains was assessed following the method described by Stepanović et al. (2007) [16], with modifications. Cultures were grown in the TSB + Y medium (30 g/L Tryptone Soy Broth; 5 g/L Yeast extract) at 200 rpm for 12 h, diluted 1:10 in fresh TSB, and incubated statically at 37 °C for 12 h. Aliquots (200 µL) were inoculated into sterile 96-well microtiter plates and incubated statically at 37 °C for 48 h; wells containing only medium served as negative controls. After incubation, non-adherent cells were removed, wells were washed with PBS, biofilms were fixed with methanol, stained with 1% crystal violet, and the bound dye was solubilized with 95% ethanol. Optical density (OD570) was measured to quantify biofilm biomass. Biofilm-forming ability was classified as follows: non-biofilm producer (ODSample ≤ ODC), weak biofilm producer (ODC < ODSample ≤ 2ODC), moderate biofilm producer (2ODC < ODSample ≤ 4ODC), and strong biofilm producer (ODSample > 4ODC), where ODC = ODControl + 3×SD (ODControl: mean absorbance of negative control wells; SD: standard deviation).
2.7. Morphological Analysis of Bacillus Biofilm by Scanning Electron Microscopy
Biofilm samples of Bacillus were diluted by mixing 1 drop of suspension in 1 mL deionized water, and a drop of the diluted sample was placed on a clean silicon wafer and air-dried at room temperature to minimize charging during SEM analysis. Morphological characterization was performed using a field-emission scanning electron microscope (FE-SEM, Hitachi S-4800) operated at 10.0 kV with a working distance of ~10.2 mm in secondary electron mode. Representative images were acquired at magnifications of 2000× and 5000× to visualize both the overall biofilm architecture and the rod-shaped morphology of Bacillus cells.
2.8. Biofilm Cultivation and Biomass Harvesting
Four high-biofilm-forming strains were cultured in Brain Heart Infusion (BHI; 10.0 g/L proteose peptone, 2.0 g/L dextrose, 5.0 g/L NaCl, 2.5 g/L Na2HPO4). For large-scale production, 800 µL of bacterial suspension was inoculated into 150-mm Petri dishes containing 80 mL of BHI (1:100 ratio), with 90 replicates per strain, and incubated statically at 37 °C for 72 h to allow mature pellicle biofilm formation. After incubation, planktonic cells were removed, biofilms were rinsed three times with sterile PBS, harvested using a cell scraper, resuspended in 2 mL PBS, and pooled into 50-mL centrifuge tubes. Biomass was concentrated by centrifugation at 10,000 rpm for 10 min at 4 °C, and the final yield was quantified by measuring wet weight (Mwet) for standardized analyses.
2.9. Statistical Analysis
Data were processed using Microsoft Excel 2016 and GraphPad Prism software. A one-way ANOVA followed by Tukey’s post hoc test was applied to compare mean values, with significance set at p<0.05. The correlation between OD570 and D95 values was evaluated using Spearman’s rank correlation and a simple linear regression model (y = ax + b).
3. RESULTS AND DISCUSSION
3.1. Isolation and Morphological Characterization of Bacillus spp
A total of seven spore-forming bacterial strains were successfully isolated from six raw cow’s milk samples collected across dairy stations in the Mekong Delta, Vietnam. The isolates exhibited typical phenotypic characteristics of the genus Bacillus: colonies were predominantly opaque white to ivory, with diameters ranging from 1 to 3 mm. Morphological variations included circular to irregular shapes, rough surfaces, and smooth or serrated edges (Fig. 1). Gram staining and biochemical screening further revealed that all isolates were Gram-positive, short rod-shaped cells, and demonstrated motility and catalase-positive activity. To confirm their taxonomic status, 16S rRNA gene sequence analysis was performed, which definitively identified all seven strains as belonging to the genus Bacillus. These isolates were subsequently utilized for thermal resistance and biofilm formation assays.
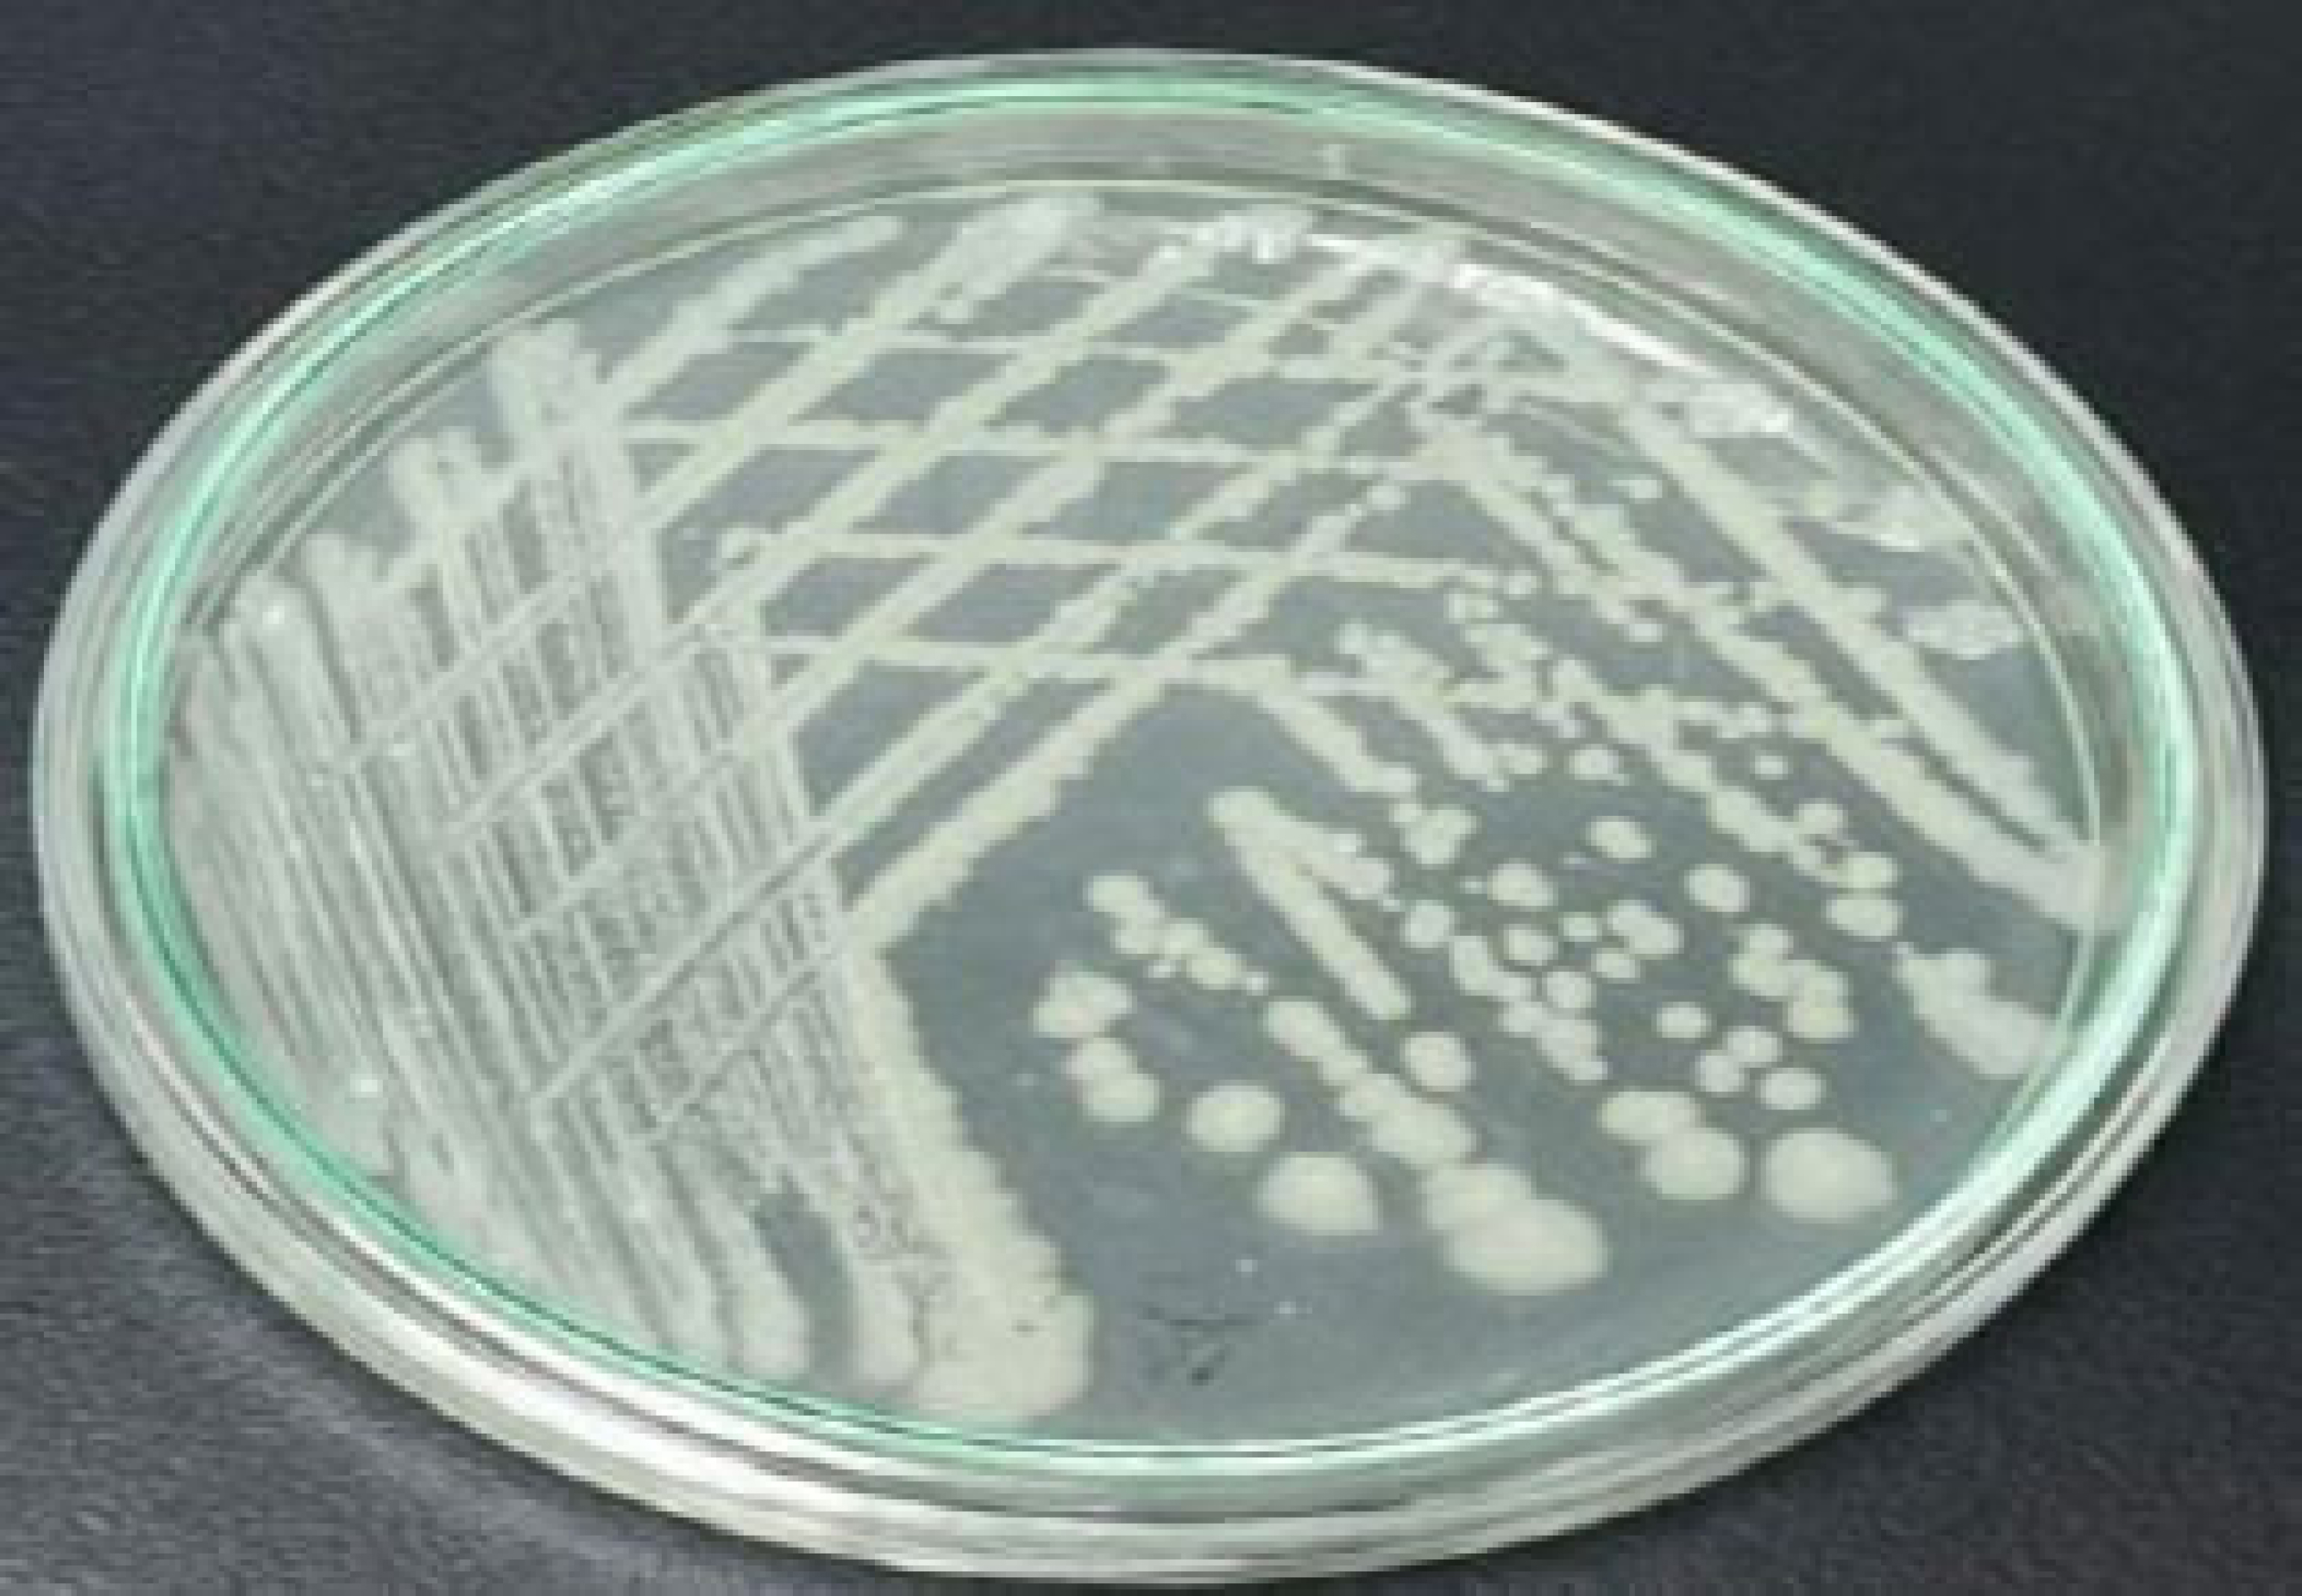
The colony morphology of the isolated strain after 24 hours incubation on LB agar.
3.2. Heat Resistance of Bacillus spp. Spores
To evaluate the heat resistance of spores from seven Bacillus spp. strains isolated from raw milk, decimal reduction times (DT values, in minutes) were determined in peptone solution across a temperature range of 80–95 °C. As shown in Fig. (2), a clear inverse relationship between treatment temperature and spore survival was observed: DT values consistently decreased with increasing temperature across all strains. For any given Bacillus strain, higher treatment temperatures resulted in lower DT values, indicating reduced thermal resistance. One-way ANOVA confirmed statistically significant differences among strains (p<0.001). Notably, Bacillus TGS11.1 and Bacillus CTS13.1 exhibited statistically greater thermal stability than the other five strains at all tested temperatures. The thermal resistance of seven Bacillus spp. strains in peptone medium at 80–95 °C was evaluated based on DT values (min), with data representing mean values from three independent replicates. One-way ANOVA followed by Tukey’s test indicated significant differences among strains (p < 0.001). Notably, strains TGS11.1 and CTS13.1 consistently exhibited higher thermal stability than the other strains across all tested temperatures. At the highest treatment temperature (95 °C), spore heat resistance is shown in Fig. (3). Mean D95 values (±SD) ranged from 11.37 ± 0.45 min for Bacillus strain TGS11.1 to 0 min for strain CTS11.3, indicating clear stratification of thermal resistance among strains (p < 0.001). Error bars represent standard deviations from three independent replicates, confirming the reliability of the data. D95 values represent the time required for a 90% reduction of spore populations at 95 °C in peptone medium. Figure 3 shows mean values from triplicate experiments, with error bars indicating standard deviations. A gradient of heat resistance was observed (p < 0.001), ranging from the most resistant strain TGS11.1 (11.37 ± 0.45 min) to the most sensitive strain CTS11.3 (0 min). These values fall within previously reported ranges: comparable to 7.10–10.40 min for Bacillus cereus from milk in Cameroon [17], but lower than the 24 min or broader 1.50–36.00 min range documented for foodborne strains [18]. Thus, the strains examined here exhibit moderate heat resistance, lower than certain pathogenic isolates yet consistent with literature values. The observed resistance is attributed to spore-specific structural and biochemical features, including a thick cortex, high Ca–DPA content, DNA-protective SASPs, and a dehydrated core, which collectively reduce protein denaturation and DNA damage under heat stress [19]. The thermal resistance of spores from the seven Bacillus isolates was quantified using decimal reduction times (DT values) in peptone solution across a temperature range of 80–95 °C. As illustrated in Fig. (2), a consistent inverse relationship was observed between treatment temperature and spore survival, with DT values significantly decreasing as temperatures increased for all strains. Statistical analysis using one-way ANOVA followed by Tukey’s post-hoc test confirmed significant differences in thermal stability among the isolates (p < 0.001). Notably, strains TGS11.1 and CTS13.1 consistently exhibited the highest thermal stability across the entire temperature range tested. At the maximum treatment temperature of 95°C (Fig. 3), the isolates displayed a clear gradient of heat resistance. The mean D95 values ranged from 11.37 ± 0.45 min for the most resistant strain (TGS11.1) to 0 min for the most sensitive (CTS11.3). These D95 values are comparable to previously reported ranges for Bacillus cereus isolated from milk (e.g., 7.10–10.40 min in Cameroon [17]). However, they remain lower than the higher thresholds documented for certain foodborne pathogenic strains [18]. Overall, the isolates examined in this study demonstrate a moderate level of heat resistance, which is consistent with the existing literature on dairy-related Bacillus environmental isolates.
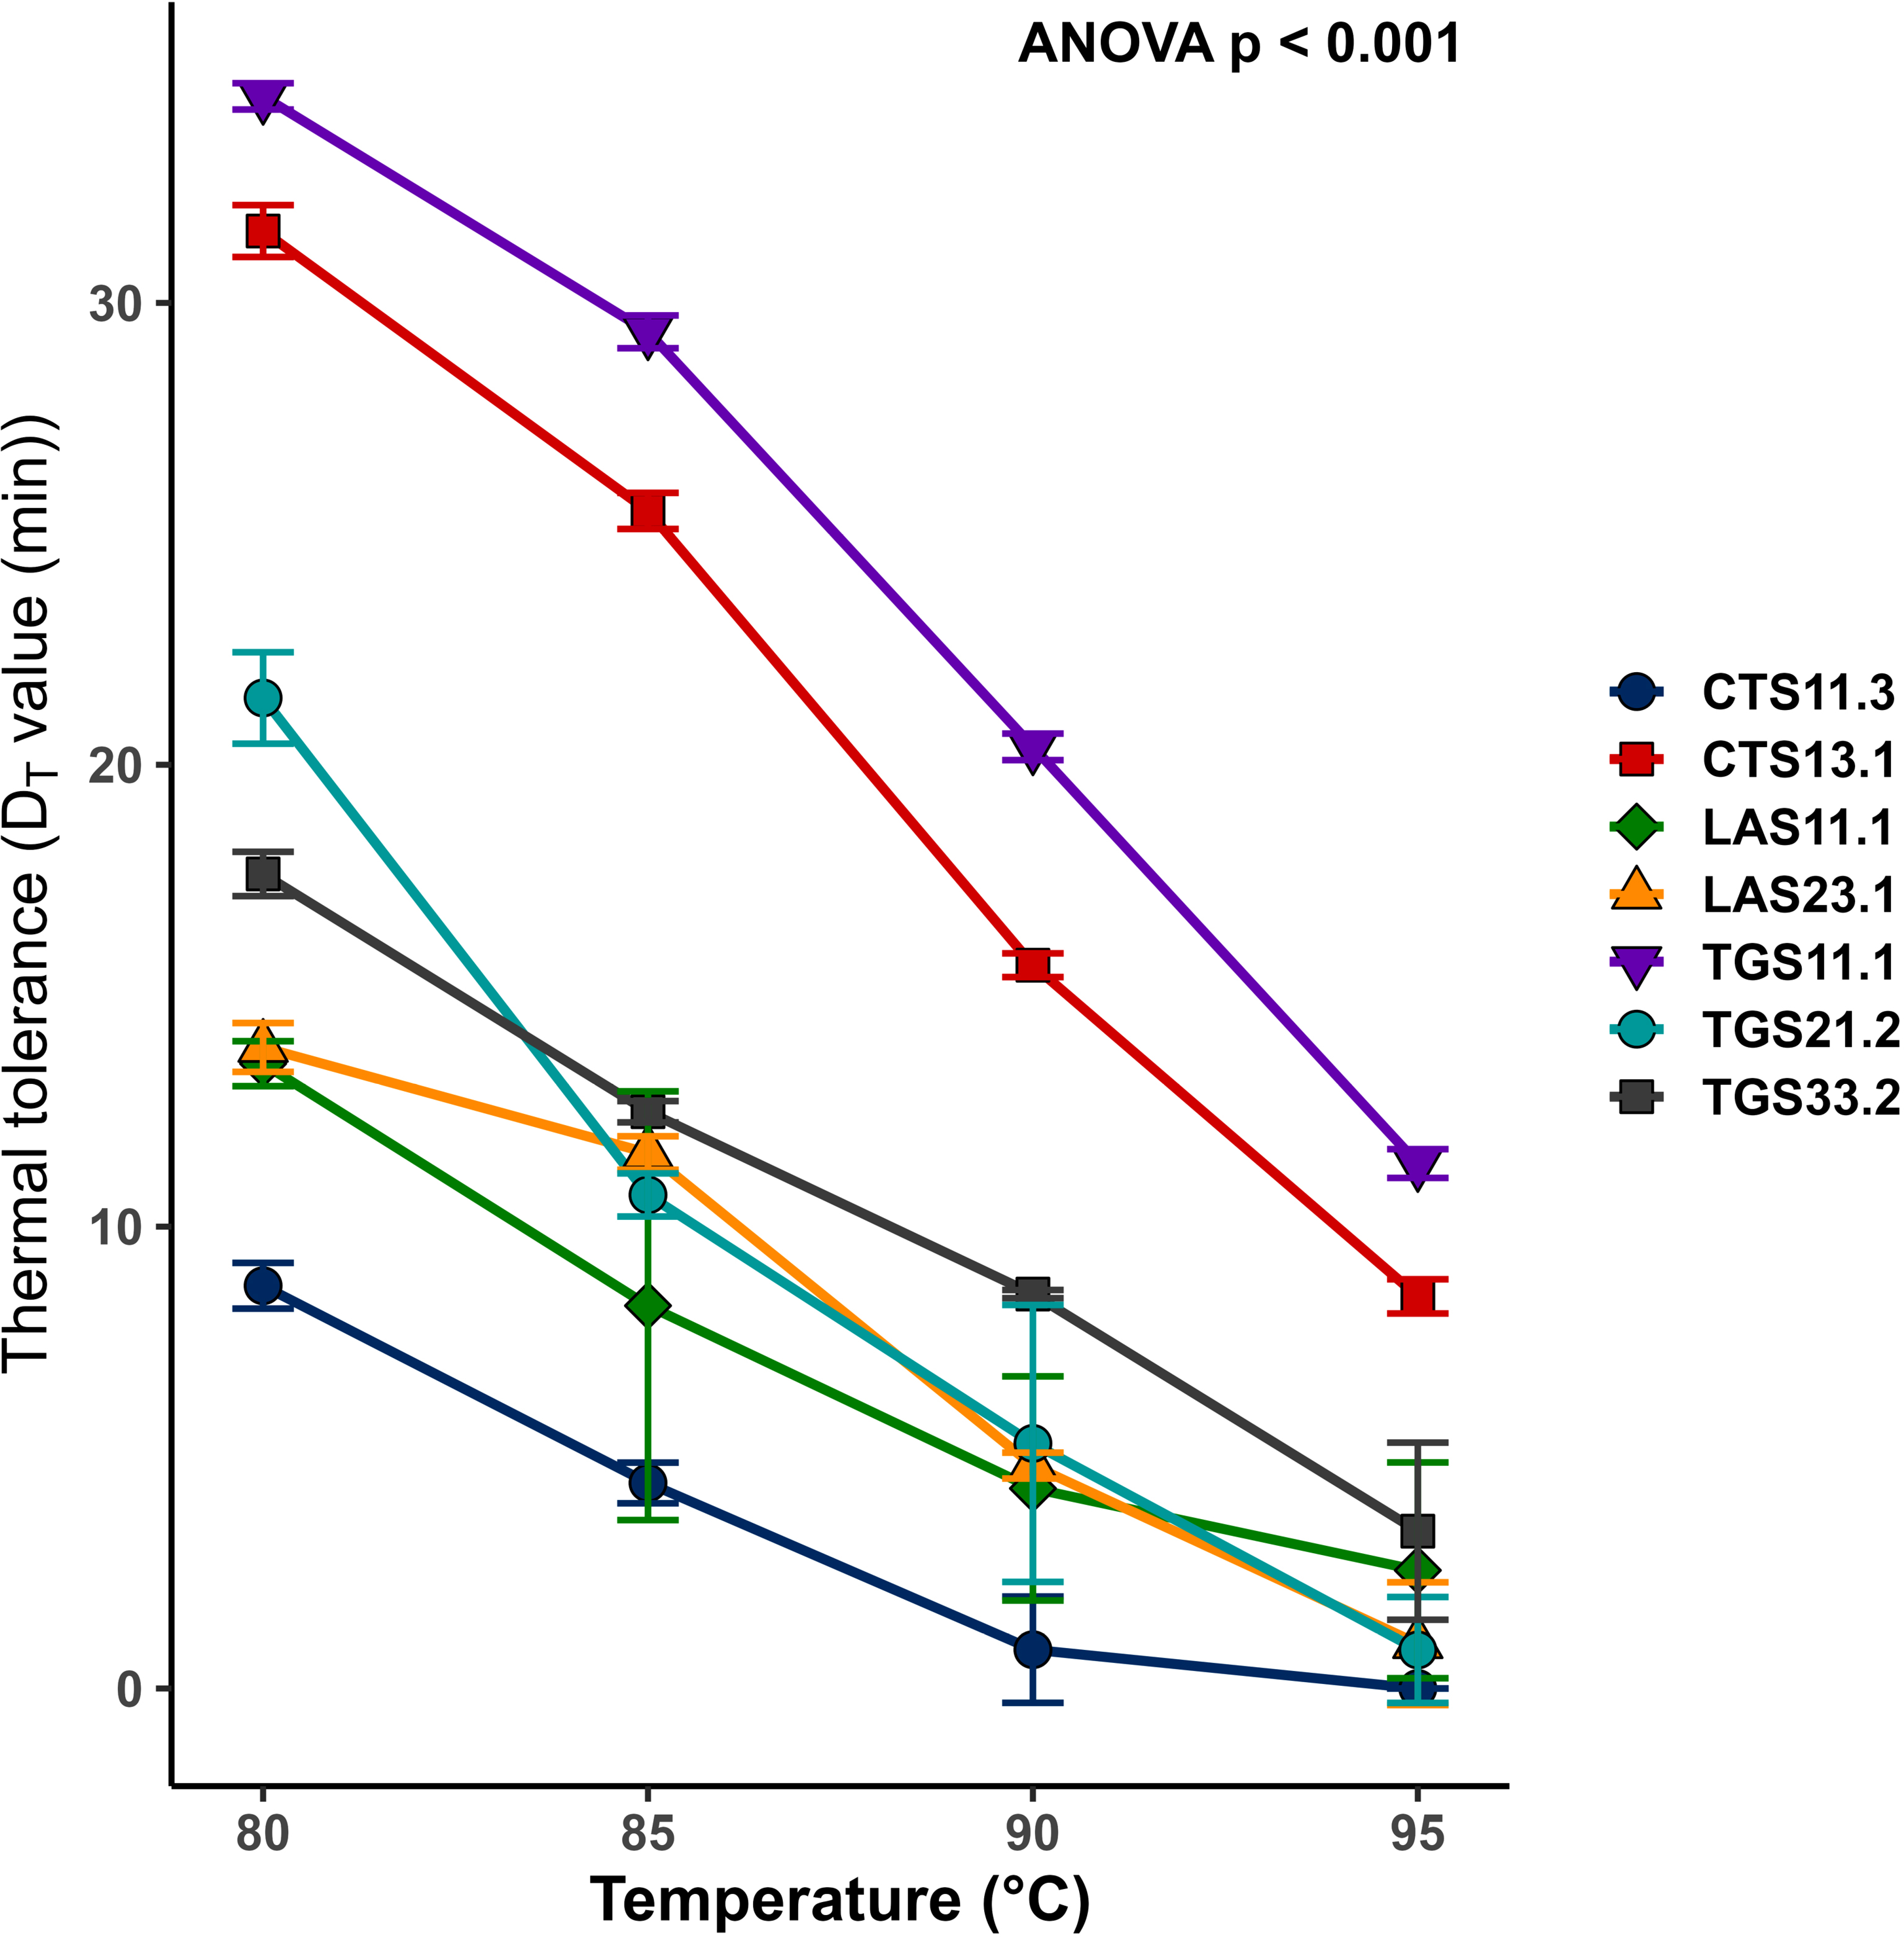
Heat resistance profiles of seven Bacillus strains' spores isolated from raw milk. The heat resistance of seven Bacillus strains in peptone medium across the temperature range of 80–95 °C was determined by DT values (minutes). Data points represent mean values from three independent replicates. One-way ANOVA analysis revealed statistically significant differences in thermal resistance among the strains (P < 0.001). Notably, Bacillus strain TGS11.1 and Bacillus strain CTS13.1 consistently exhibited higher thermal stability compared to the other strains at the same tested temperatures.
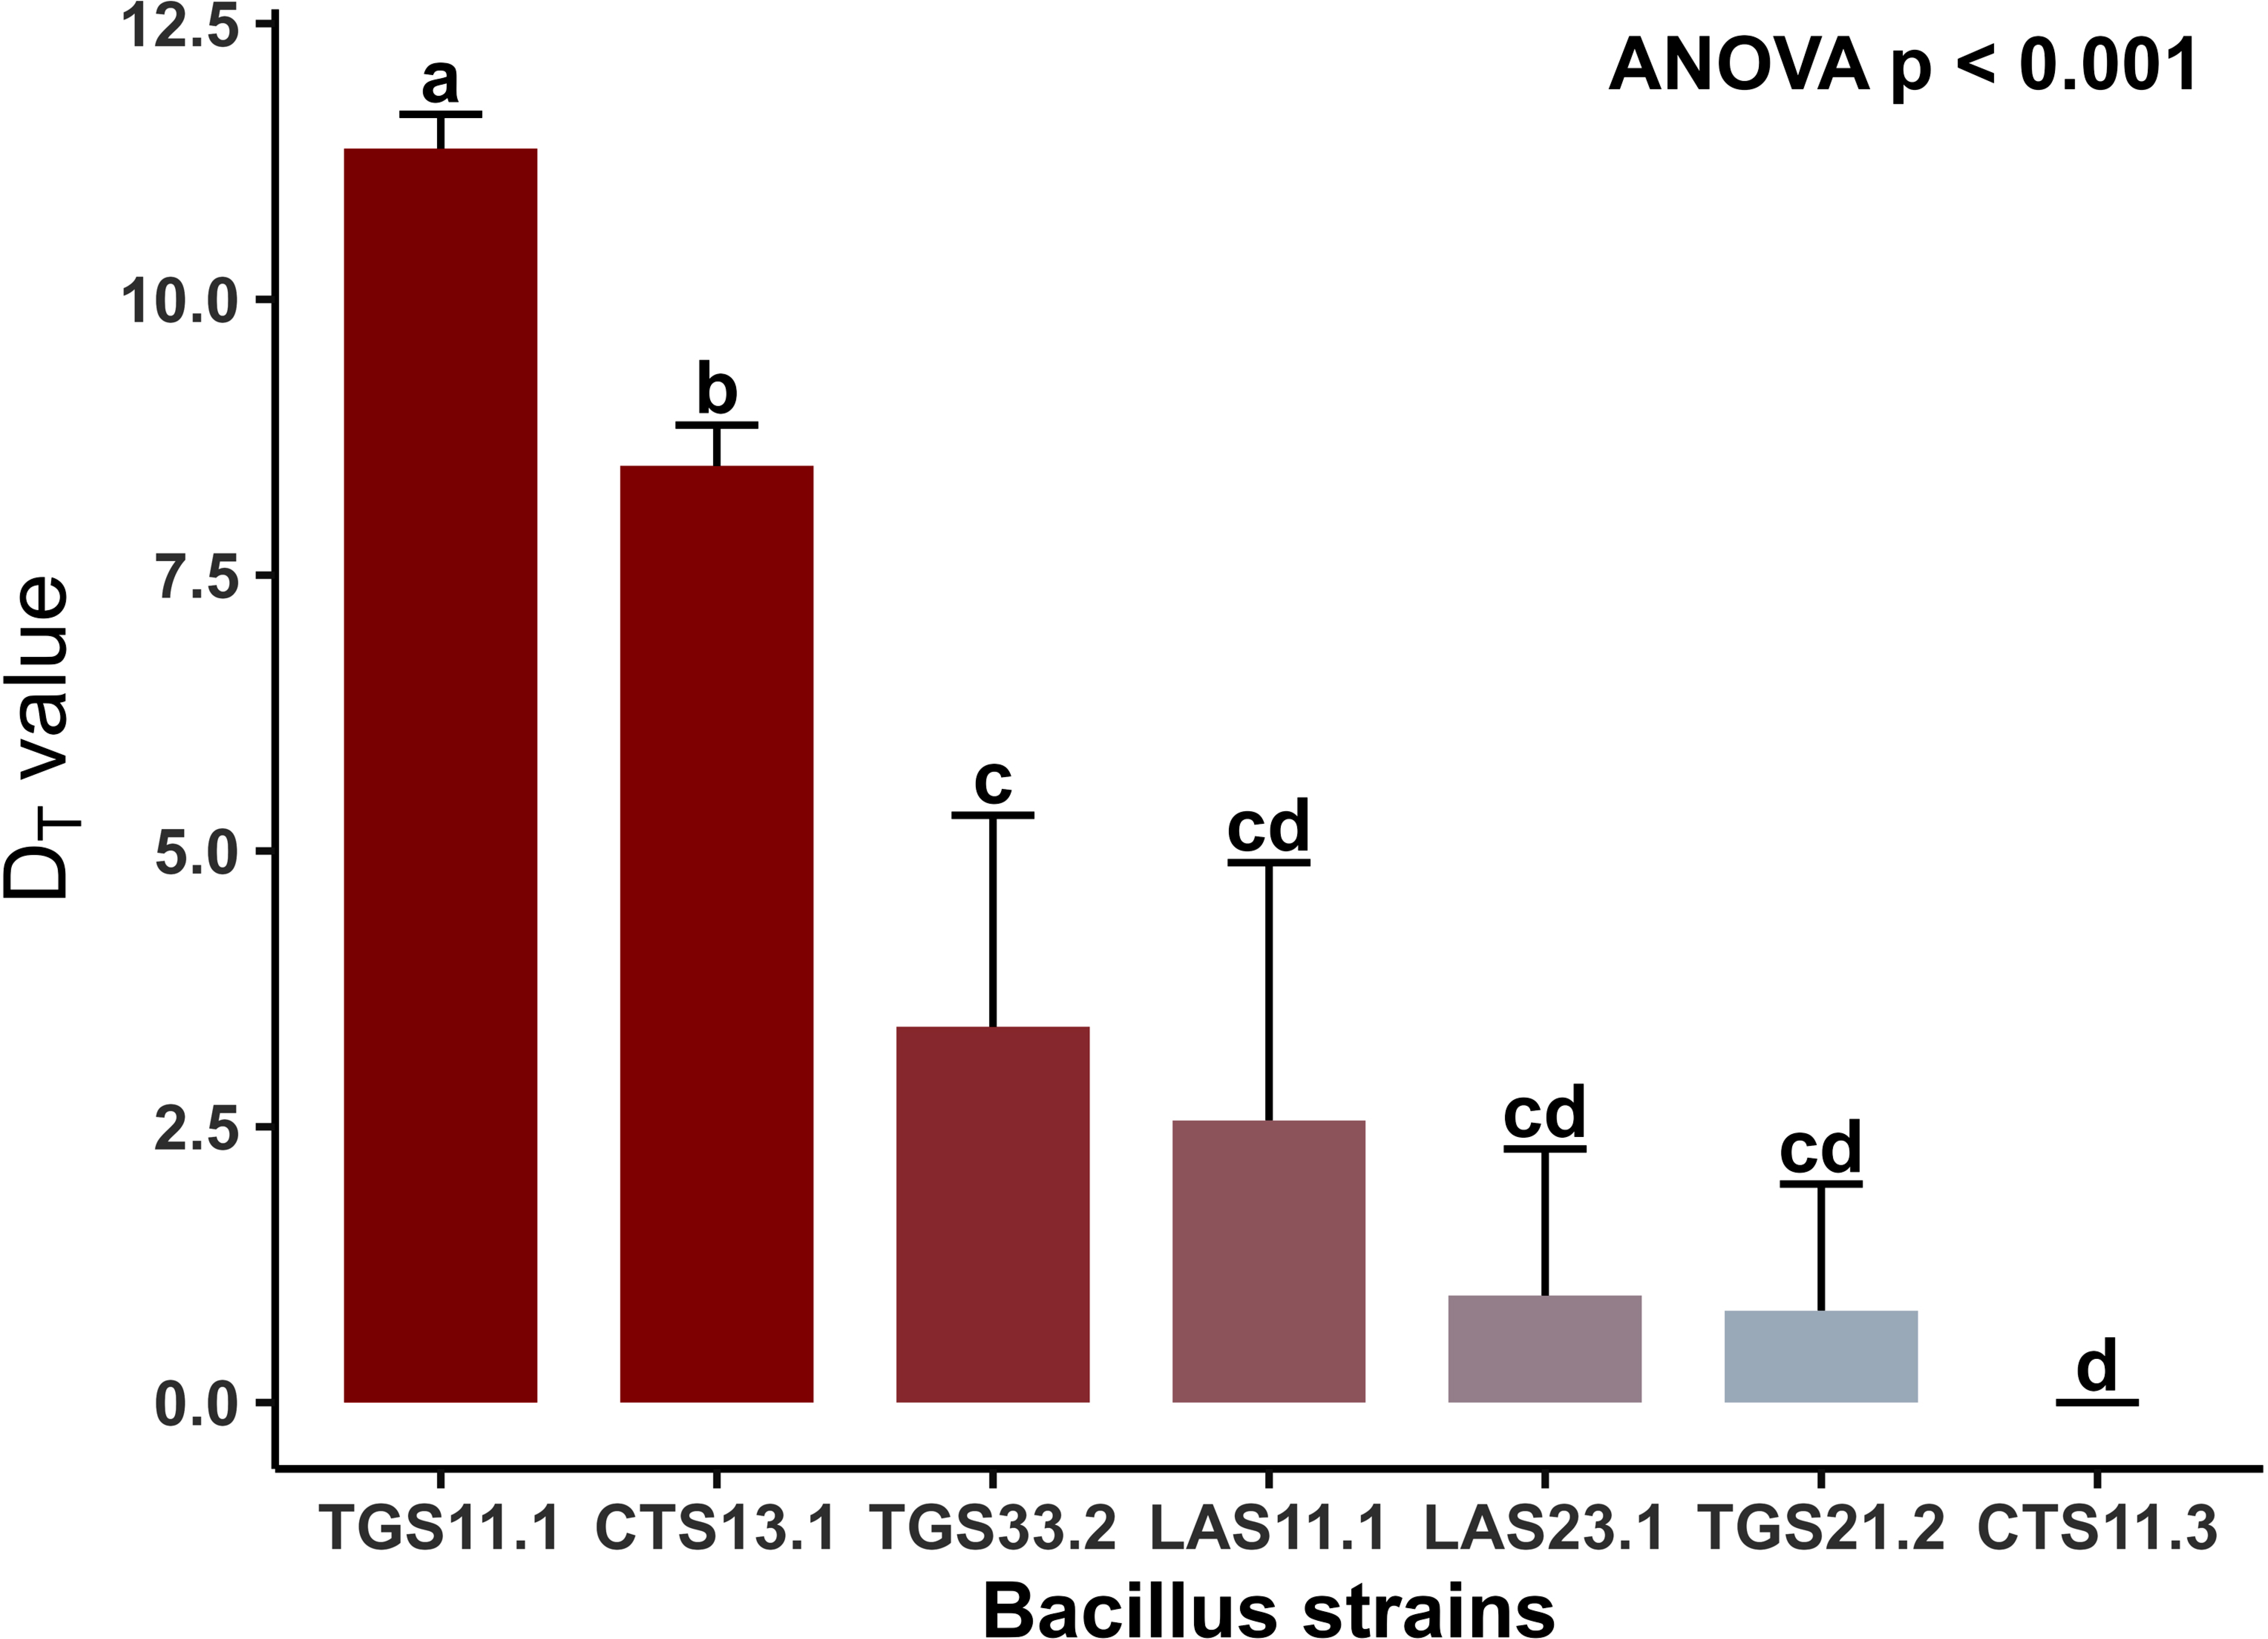
Heat resistance (DT value) of spores of seven Bacillus spp. strains at 95 °C. The D95 values (minutes) represent the time required to reduce the spore population by 90% at a constant temperature of 95°C in peptone medium. Bars represent the mean values of triplicate experiments, with error bars indicating the standard deviation (SD). Different shades of red are used to highlight the gradient of heat resistance, from the most resistant (TGS.11.1) to the most sensitive (CTS.11.3) strains (p < 0.001) at 95 °C.
3.3. Assessment of Biofilm Formation by Seven Bacillus spp. Strains using the Crystal Violet Assay
The biofilm-forming ability of seven Bacillus strains isolated from fresh cow’s milk was evaluated using the CV staining method on sterile 96-well plates, followed by measuring optical density at 570 nm. Qualitative and quantitative results (Figs. 4 and 5) indicated that all tested strains formed biofilms at varying levels. Biofilm biomass was quantified using the crystal violet assay, with results expressed as mean OD570 values from three independent experiments performed in triplicate (error bars = SD). One-way ANOVA revealed significant differences among strains (p < 0.001). Based on OD thresholds, strains were classified as strong biofilm formers (TGS11.1, OD570 > 4ODC), moderate formers (CTS13.1, TGS33.2, TGS21.2, CTS11.3, LAS23.1, OD570 between 2ODC and 4ODC), and weak formers (LAS11.1, OD570 ≤ 2ODC). Tukey’s post-hoc test (p < 0.05) confirmed significant differences between the strong (TGS11.1) and weak (LAS11.1) groups, whereas the moderate group did not differ significantly from either. The threshold ODC value was determined to be 0.0704. Based on this threshold, biofilm formation was classified as weak, moderate, or strong. Strain LAS23.1 was identified as a weak biofilm producer (OD570 < 2ODC). Five strains CTS11.3, CTS13.1, LAS11.1, TGS21.2, and TGS33.2 were classified as moderate producers (OD570 around 2ODC). Strain TGS11.1 exhibited the strongest biofilm formation, with a mean OD value of 0.3196 ± SD, approximately 4.5-fold higher than ODC. One-way ANOVA revealed no statistically significant differences in OD570 values among strains (p>0.05). Visual observations supported the quantitative results. Crystal violet staining of 96-well microtiter plates (Fig. 5A) and the inner surfaces of microcentrifuge tubes (Fig. 5B) showed distinct differences in staining intensity. Strain TGS11.1 retained the darkest violet color, consistent with its highest OD value, whereas LAS23.1 exhibited only faint staining, reflecting low biofilm biomass. All experiments were performed in triplicate to ensure reproducibility.
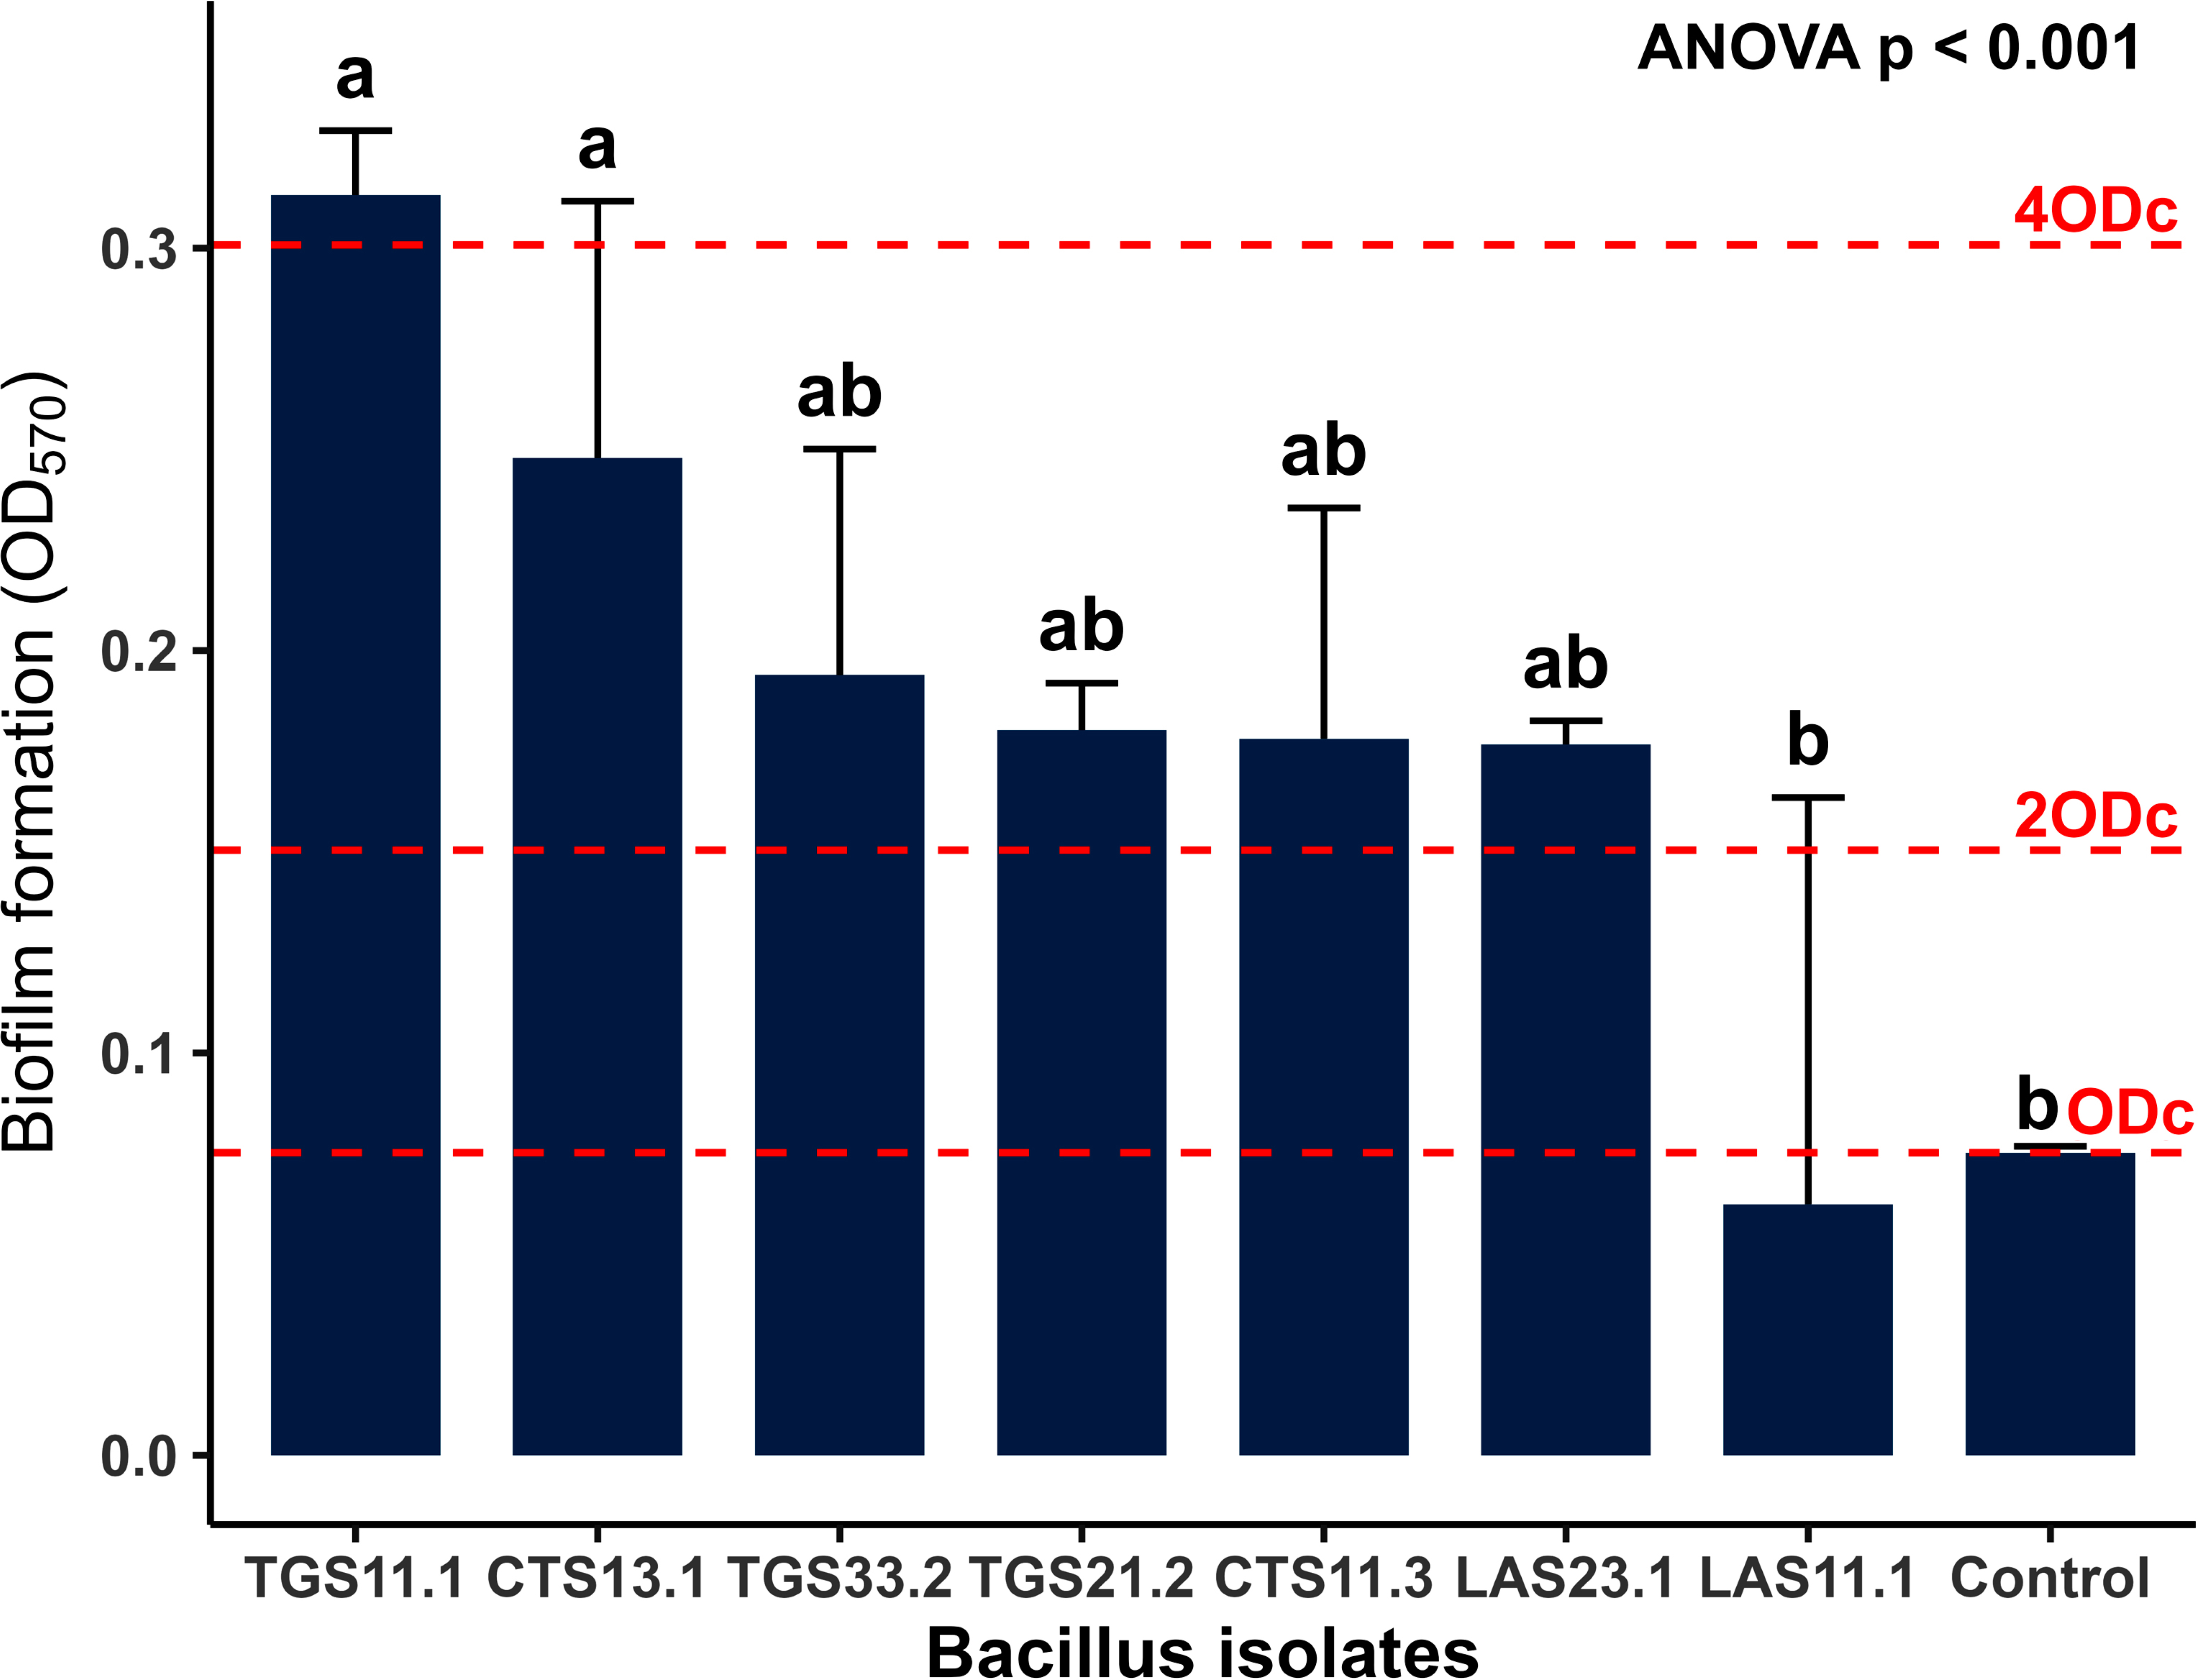
Biofilm formation profiles of seven Bacillus strains isolated from raw cow milk. Biofilm biomass was quantified using the crystal violet assay, with results expressed as the mean optical density at 570 nm (OD570. Data points represent the mean values from three independent experiments performed in triplicate, with error bars indicating the standard deviation (SD). Statistical analysis using one-way ANOVA revealed significant differences in biofilm-forming ability among the strains (P < 0.001. Different lowercase letters above the bars denote statistically significant differences between specific strains as determined by Tukey’s post-hoc test (p < 0.05).
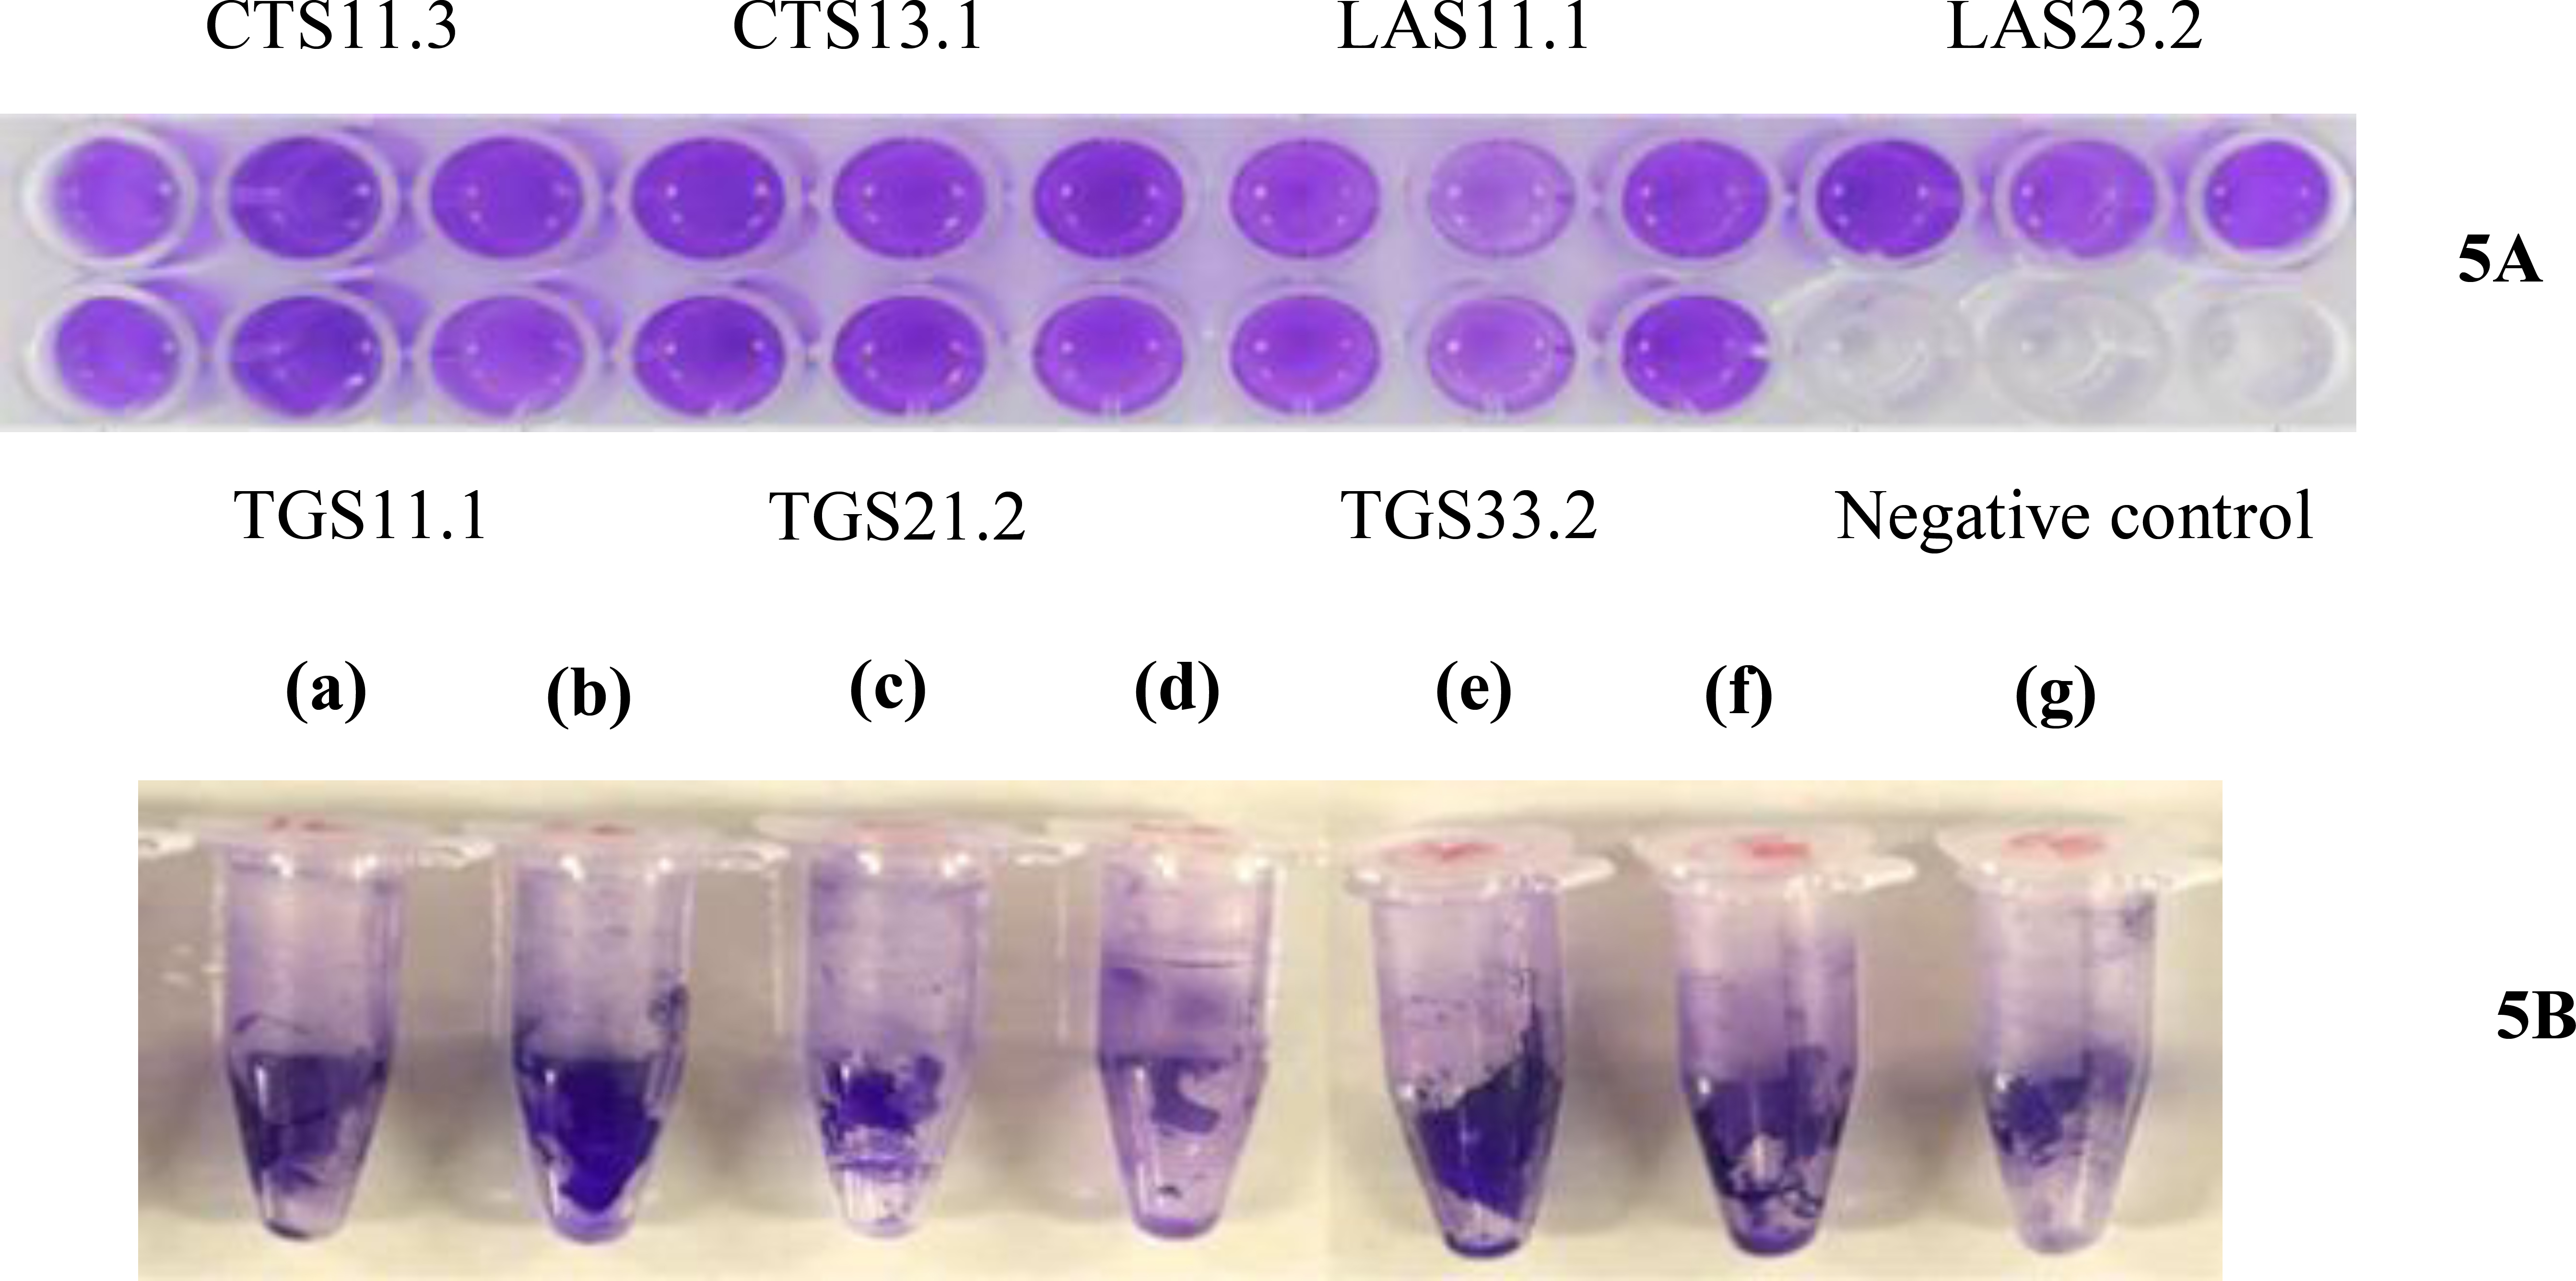
Qualitative assessment of biofilm formation by seven Bacillus isolates. (5A) Representative 96-well microtiter plate following crystal violet (CV) staining, illustrating biofilm biomass distribution across seven Bacillus spp. strains. (5B) CV-stained biofilms formed on the inner surfaces of microcentrifuge tubes, showing strain-specific differences in dye retention. Tubes correspond to strains (a) CTS11.3, (b) CTS13.1, (c) LAS11.1, (d) LAS23.1, (e) TGS11.1, (f) TGS21.2, and (g) TGS33.2, with the intensity of blue/purple coloration reflecting relative biofilm matrix abundance. Experiments were performed in triplicate to ensure reproducibility.
3.4. Biofilm Morphology of the Bacillus Strain TGS11.1 observed by Scanning Electron Microscopy (SEM)
Direct visualization of biofilm architecture in the most heat-resistant strain, the Bacillus strain TGS11.1, was conducted by using SEM. The results revealed that this strain was capable of forming a highly robust and complex biofilm matrix. At 5,000× magnification, bacterial cells displayed the characteristic rod-shaped morphology of the genus Bacillus, with uniform size and densely packed arrangements forming multiple overlapping layers (Fig. 6A). At 2,000× magnification, bacterial cells were observed to be densely packed and overlapping, forming a three-dimensional structure. This arrangement demons-trated strong intercellular adhesion, which supports the maintenance of a stable biofilm architecture. Perhaps the kind of structural matrix helps protect the bacterial community against external influences (Fig. 6B-D).
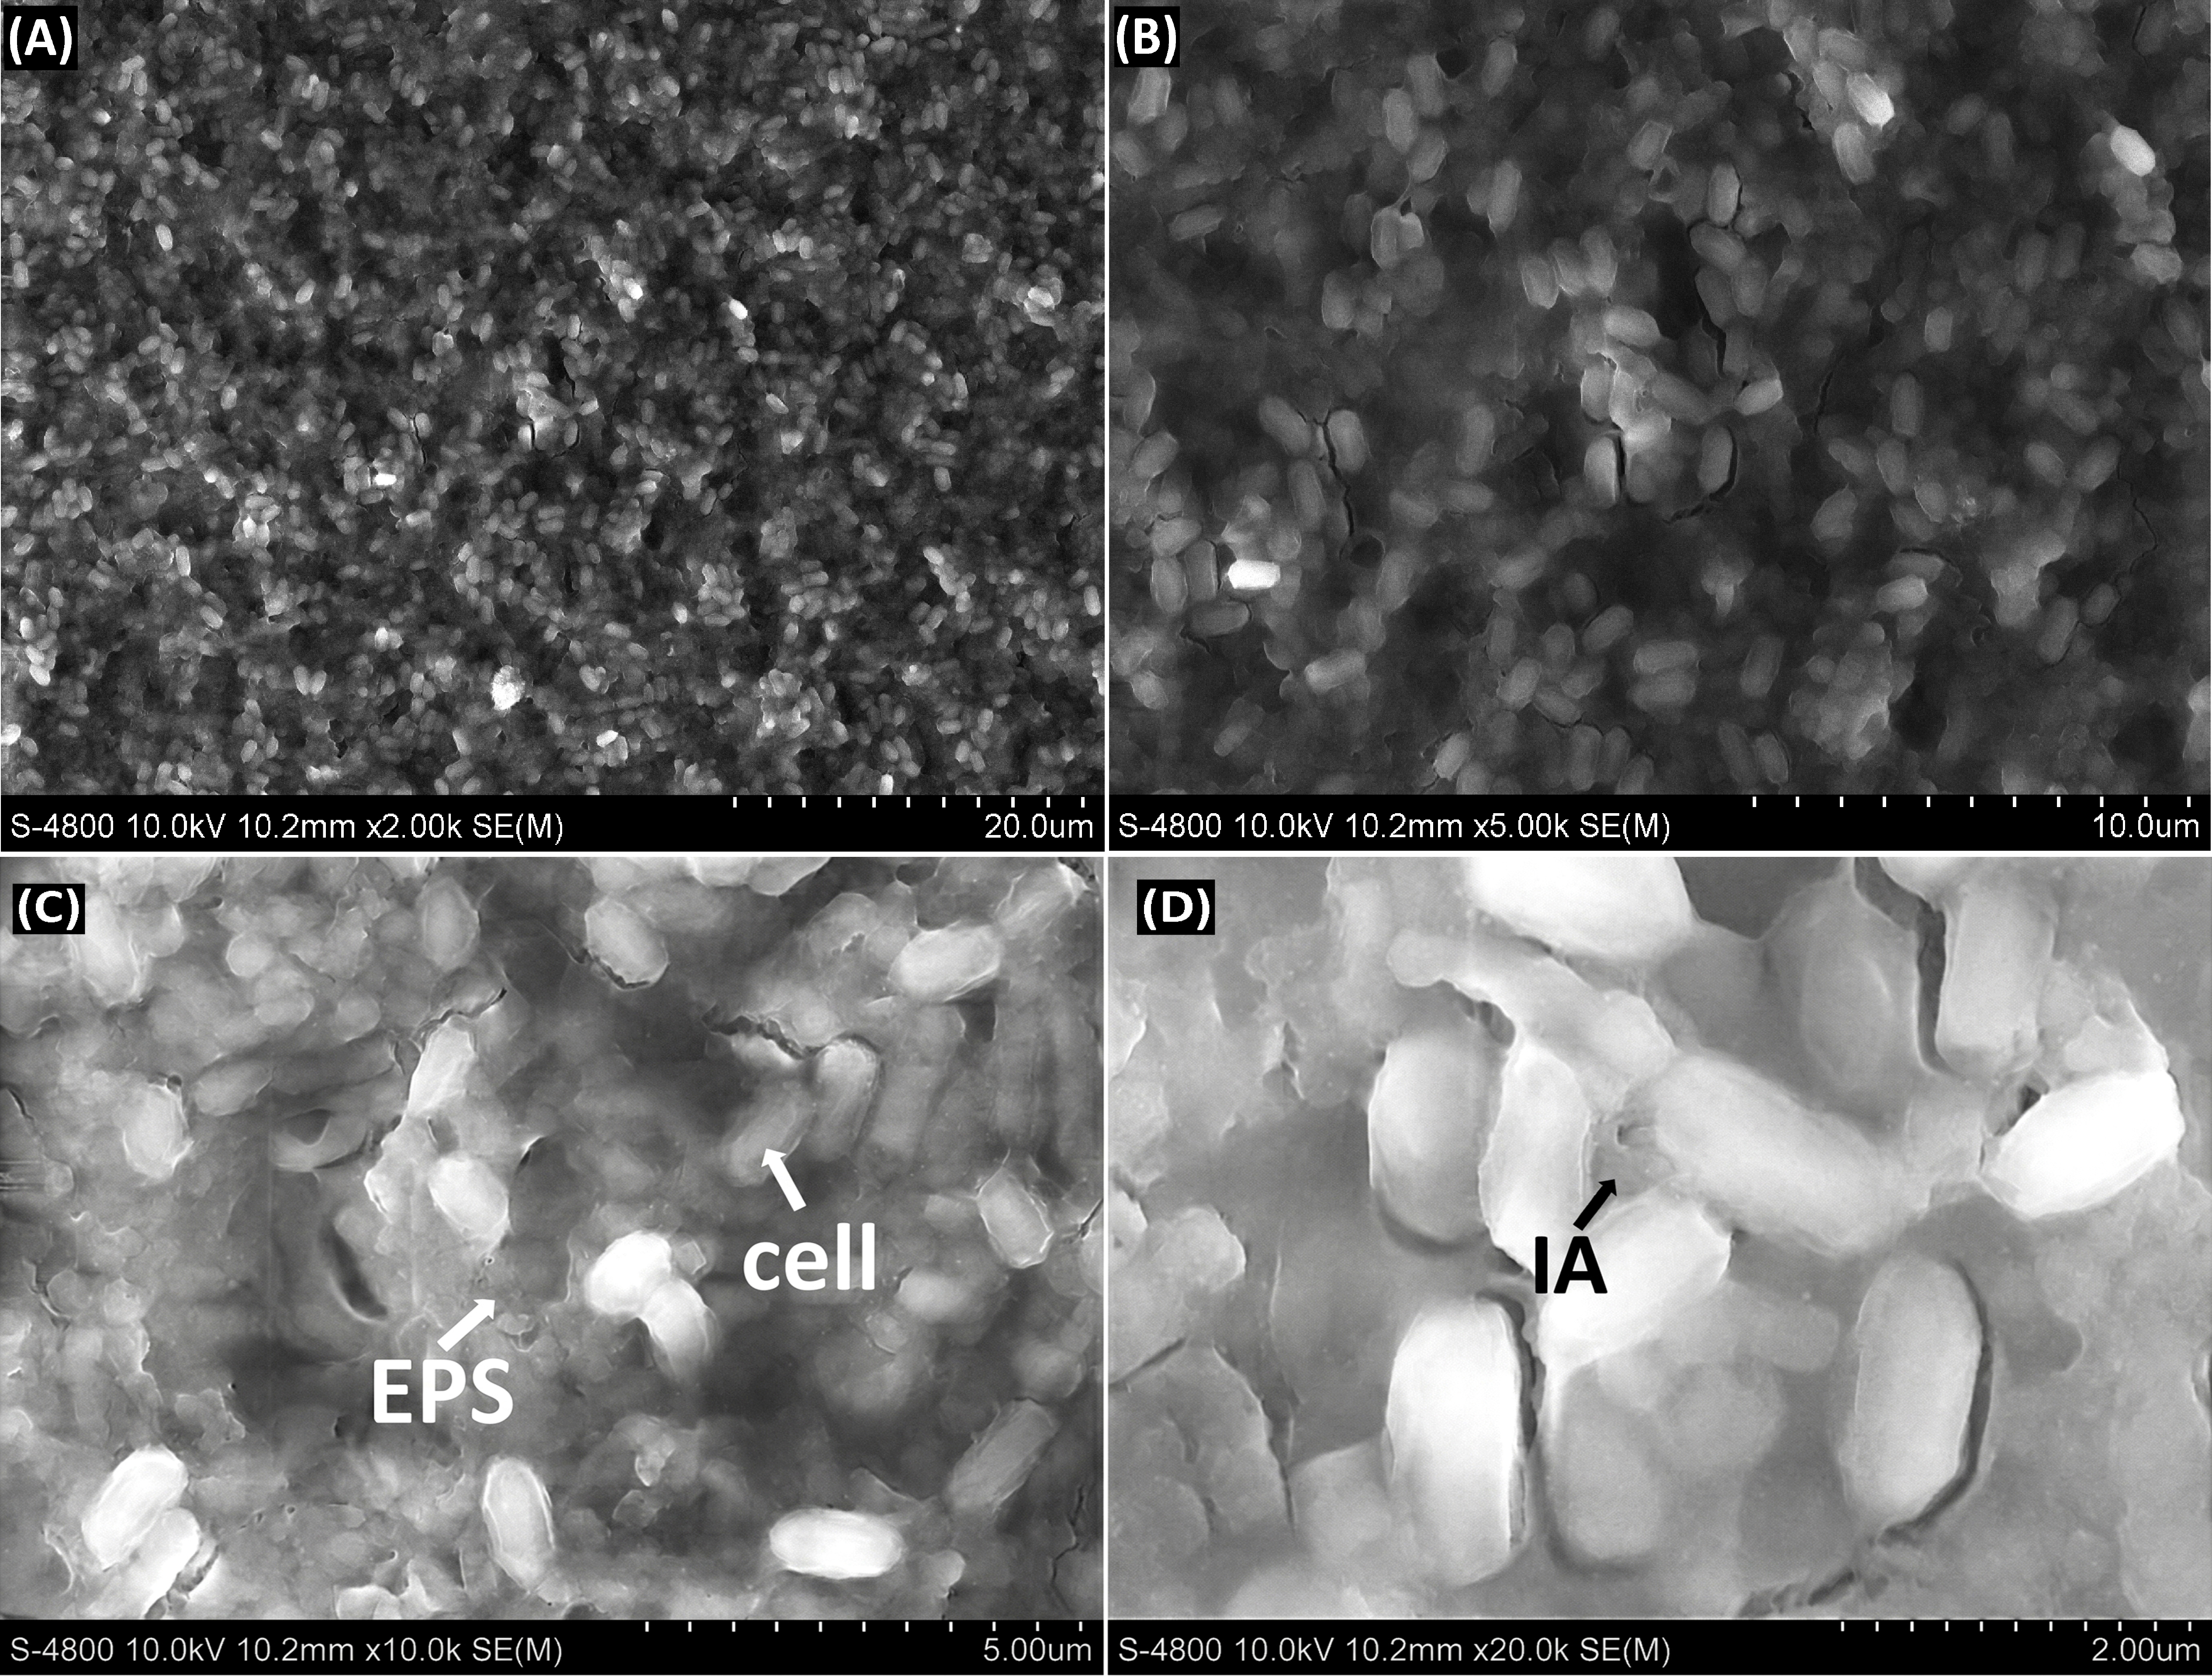
Scanning electron microscopy (SEM) micrographs illustrating the robust 3D biofilm architecture of Bacillus sp. strain TGS11.1. (A–B) Overview at 2,000× and 5,000× magnification showing a dense, multi-layered 3D structure. (C–D) Detailed microstructure at 10,000× and 20,000× magnification. Arrows (EPS) film-like matrix encapsulating the bacterial community, forming a structural “thermal shield“, Arrows (Cell): Rod-shaped cells of strain TGS11.1 embedded within the matrix, Arrows (IA): Intercellular adhesion zones establishing a stable, resistant biofilm framework.
3.5. Correlation between Optical Density and Crude Biofilm Biomass
To verify whether OD570 measurements accurately reflected the physical accumulation of biofilm biomass, crude biofilm mass was quantified for two representative strains after 96 h of incubation. The strain TGS11.1, selected from the strong biofilm-forming group based on its highest OD570 value, and the strain CTS13.1, chosen from the moderate group with the highest OD570 value, were analyzed. The results, presented in Table 1 and Fig. (6), demonstrated that OD570 values corresponded well with the measured crude biofilm biomass, supporting the reliability of OD570 as a proxy for biofilm quantification. The physical mass of harvested biofilm was consistent with the optical density (OD570) characteristics previously recorded. Specifically, the strain TGS11.1 produced the highest biomass at 3.54 g, approximately twice that of the strain CTS13.1 (1.76 g) (Table 1). Visual observations further supported these quantitative data: the thickness of the biofilm layer adhering to the Petri dish surface (Fig. 7A) and the volume of precipitate obtained after centrifugation (Fig. 7B) were proportional to the measured biomass. Biofilm formation in Bacillus spp. is influenced by multiple environmental conditions and intrinsic cellular properties. Among these, motility mediated by flagella plays a critical role in promoting the initial adhesion phase and facilitating subsequent biofilm development. Flagellar-driven movement enhances bacterial access to surfaces, increases opportunities for cell-surface interactions, and supports the establishment of a stable biofilm matrix. In addition, strains carrying dominant genotypes for exopolysaccharide (EPS) synthesis, regulated by central factors such as Spo0A and the SinR/SinI system, typically produce thick, stable biofilms that develop in the form of submerged biofilms. These regulatory pathways promote EPS accumulation, reinforce structural integrity, and enable the persistence of biofilm communities under diverse environmental conditions. This phenotype-genotype divergence helps explain the persistence of Bacillus cereus in both environmental niches and food-processing lines. Strains with genetic profiles favoring exopolysaccharide synthesis and biofilm development can establish resilient communities, while their phenotypic traits, such as strong adhesion and multilayered biofilm structures, enable survival under stress conditions. Together, these features contribute to the long-term presence of Bacillus cereus in industrial settings, complicating eradication efforts and increasing the risk of contamination [20]. In this study, the strain TGS11.1 was chosen as the target strain for correlation analysis between biofilm formation capacity and heat resistance. This strain exhibited both the highest thermal tolerance and the strongest biofilm production among the isolates tested, making it an appropriate representative for evaluating the relationship between these two phenotypic traits.
| Isolates | Incubation Time (hours) | Biofilm Biomass |
|---|---|---|
| TGS11.1 | 96 | 3.54 g |
| CTS13.1 | 96 | 1.76 g |
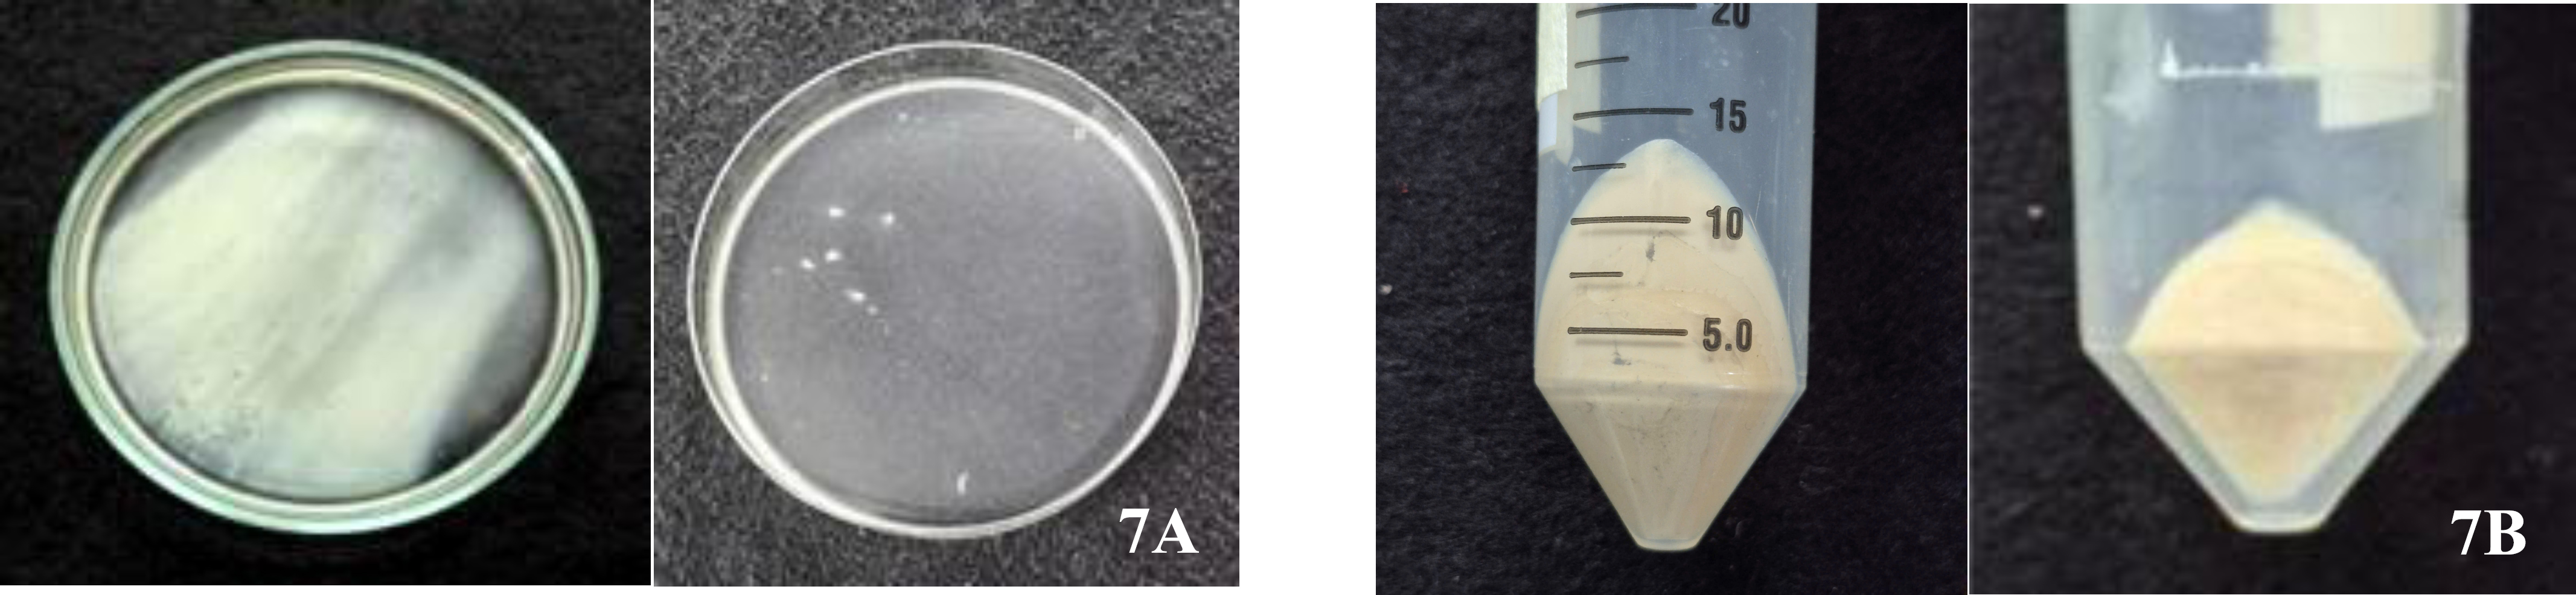
Macro-structural characterization of biofilm formation by the most heat-resistant Bacillus sp. strains, TGS 11.1 and CTS 13.1. (A) Physical attachment of mature biofilms on the bottom surface of Petri dishes after 72 hours of incubation in Tryptic Soy Broth (TSB); (B) Macroscopic appearance of harvested crude biofilm biomass in 50 mL conical tubes following PBS washing and centrifugation.
3.6. Correlation between Heat Resistance and Biofilm Formation and its Practical Implications
To test the hypothesis that biofilm formation is associated with heat resistance in Bacillus spp., correlation and linear regression analyses were performed. A strong, positive, and statistically significant correlation was observed between OD570 and D95, with Spearman’s rho = 0.881 (p = 0.00174). The scatter plot (Fig. 8) demonstrates that strains with greater biofilm biomass exhibited spores with stronger thermal resistance. Linear regression (y = 0.0127x + 0.1632) yielded R2 = 0.881, indicating that biofilm formation explained ~88% of the variation in heat resistance. The slope (a = 0.0127) suggests that each unit increase in OD570 extended spore survival at 95 °C by 0.0127 min. Despite strain-specific variation (e.g., CTS11.3, TGS21.1), the relationship remained statistically significant (p < 0.01). These findings provide experimental evidence that the EPS matrix acts as a protective barrier against heat stress and support the predictive value of biofilm development for spore thermal resistance.
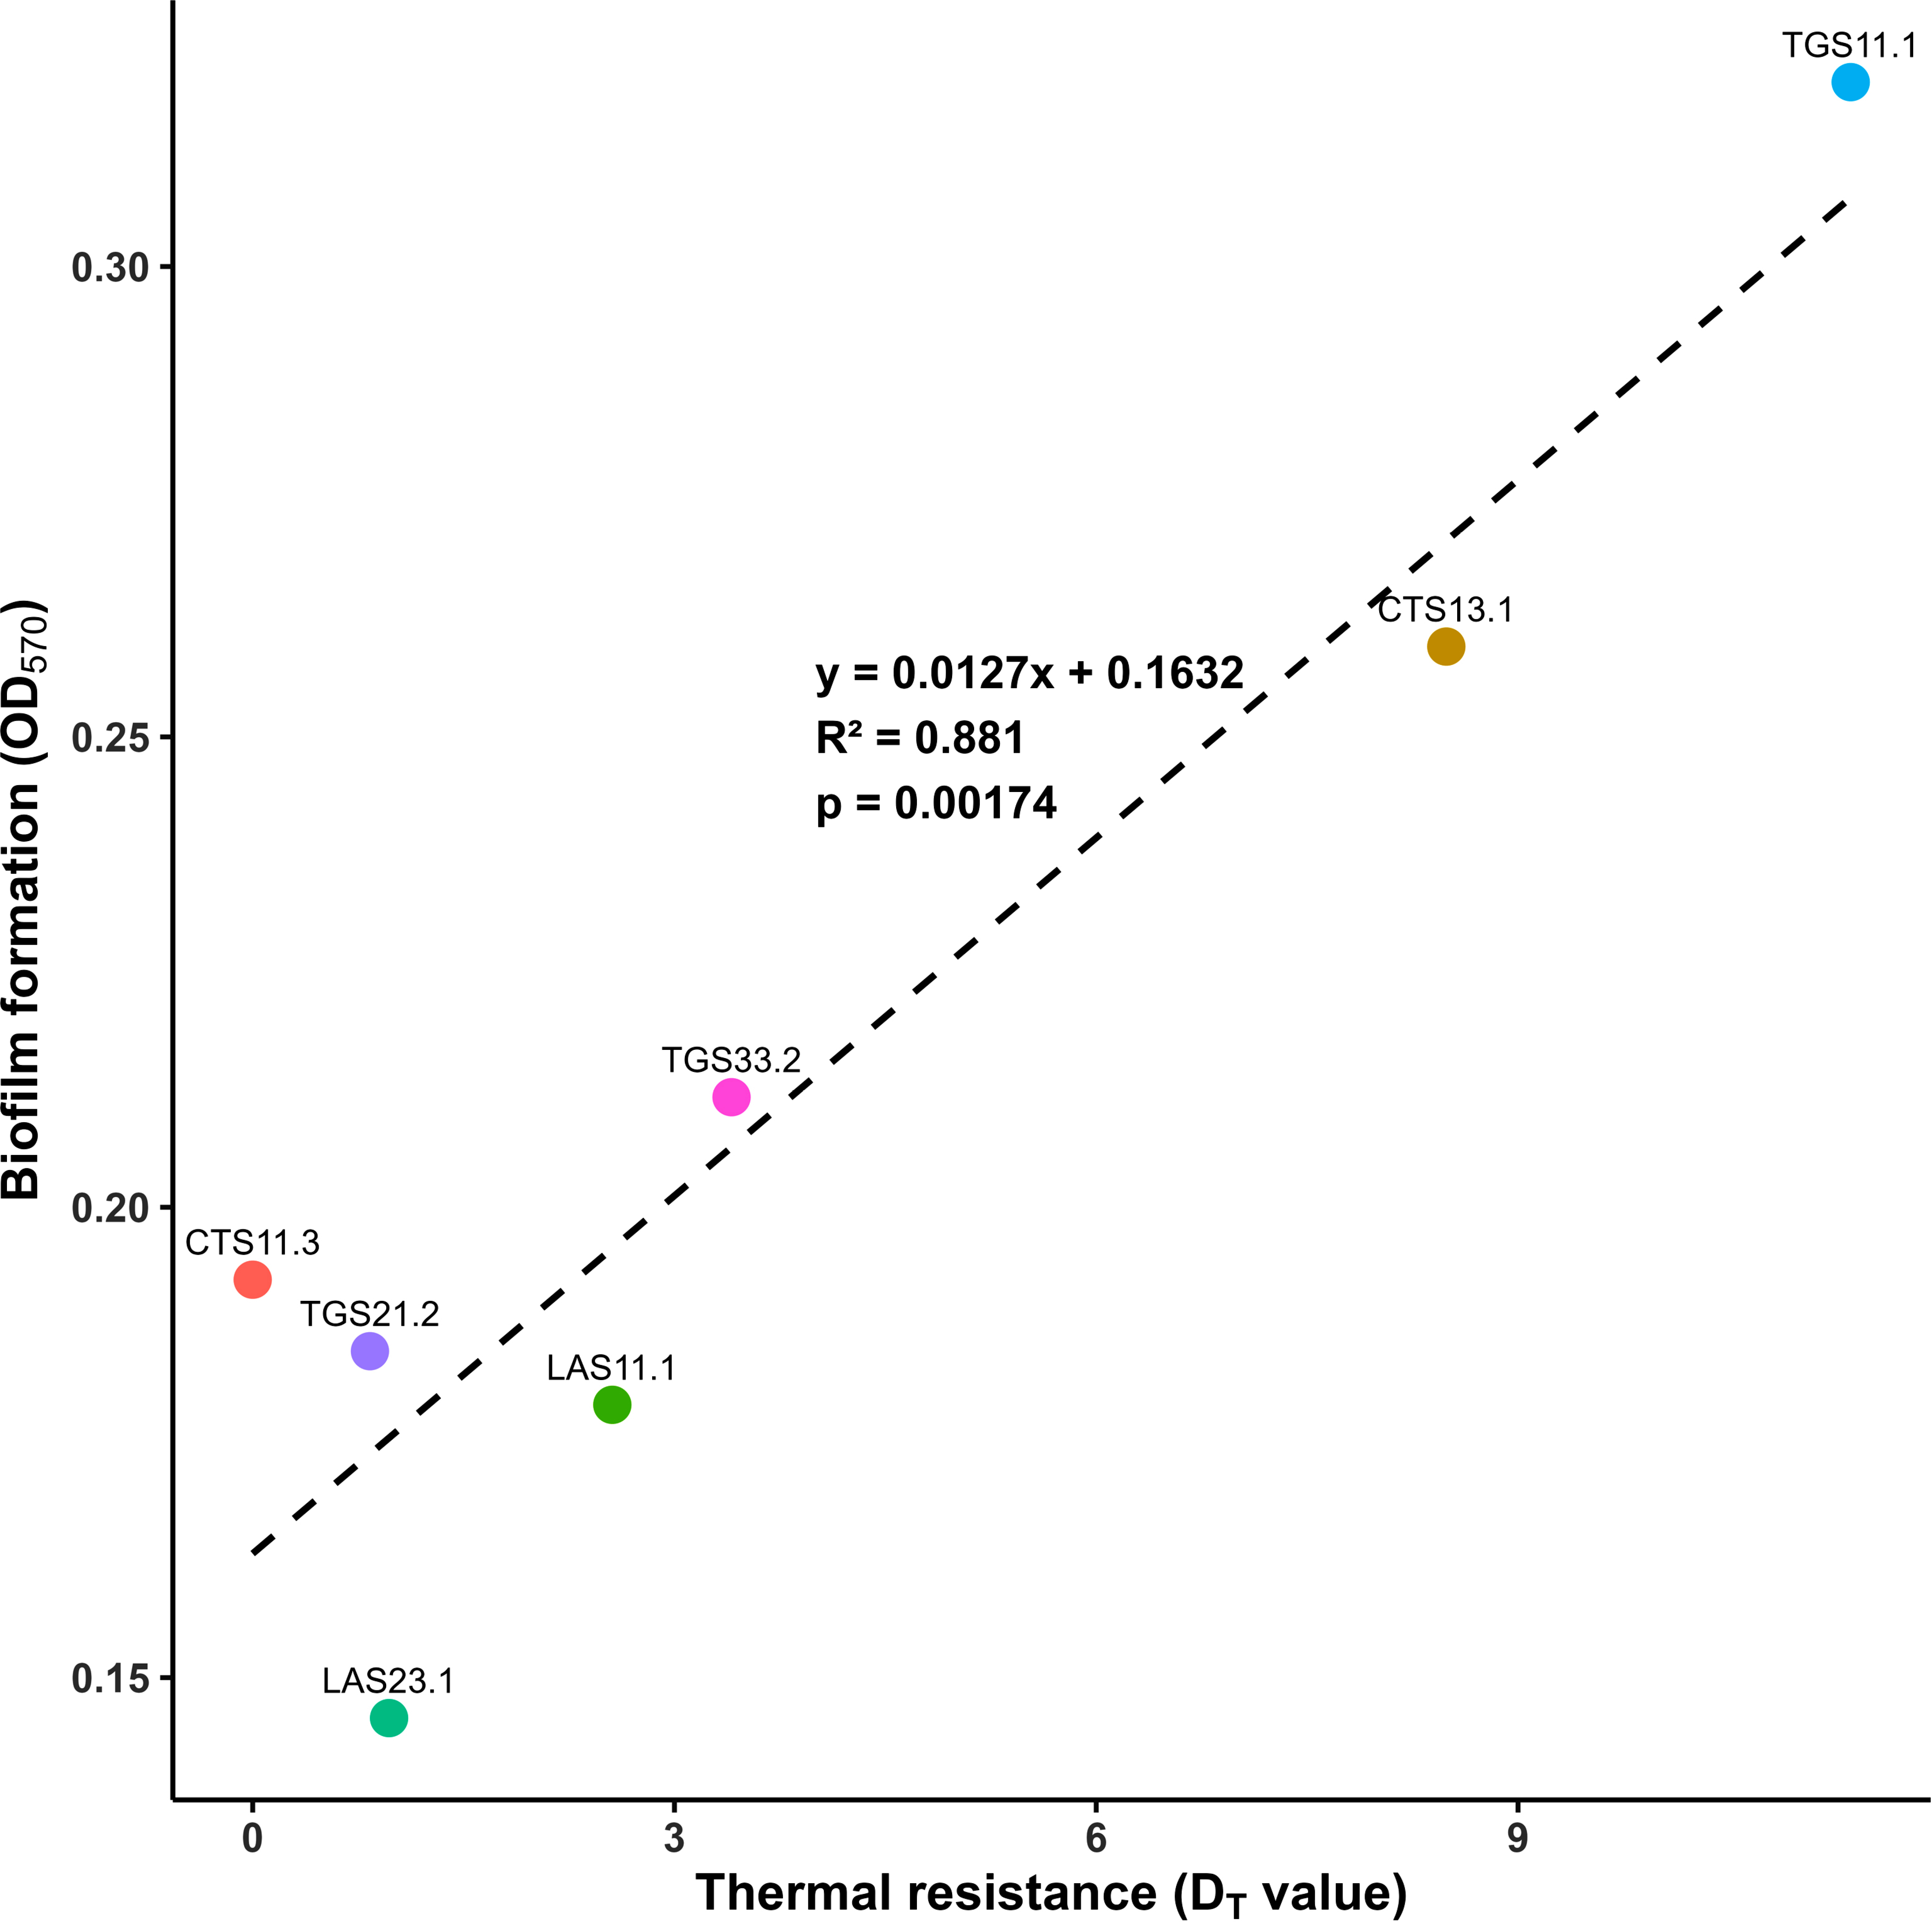
Correlation between biofilm formation and thermal resistance of the Bacillus spp. spores.A scatter plot illustrates the linear relationship between biofilm-forming capacity (OD570) and heat resistance (D95) across seven isolates. The regression line (y = 0.0127x + 0.1632) yielded R2 = 0.881 and Pearson’s r = 0.938, indicating a strong, statistically significant positive correlation (p = 0.00174). Data points represent mean values from three independent replicates, with error bars denoting standard deviations.
3.7. Genetic Relationships of the Seven Bacillus spp. Strains with Bacterial Strains
A 16S rRNA-based phylogenetic tree was constructed to determine the taxonomic position of Bacillus isolates from raw cow milk, with Escherichia coli NBRC 102203 as the outgroup (Fig. 9). The seven isolates (highlighted in red) formed a monophyletic clade with maximum bootstrap support (100%), confirming their affiliation with the genus Bacillus. Within the genus, the isolates tended to cluster with the Bacillus cereus group (e.g., Bacillus cereus, Bacillus paramycoides, Bacillus albus, Bacillus pacificus), though bootstrap values <50% prevented definitive species-level identification. Overall, the results indicate close evolutionary relatedness among the isolates, while also highlighting the limited resolution of 16S rRNA sequencing for distinguishing species boundaries within the Bacillus cereus group.
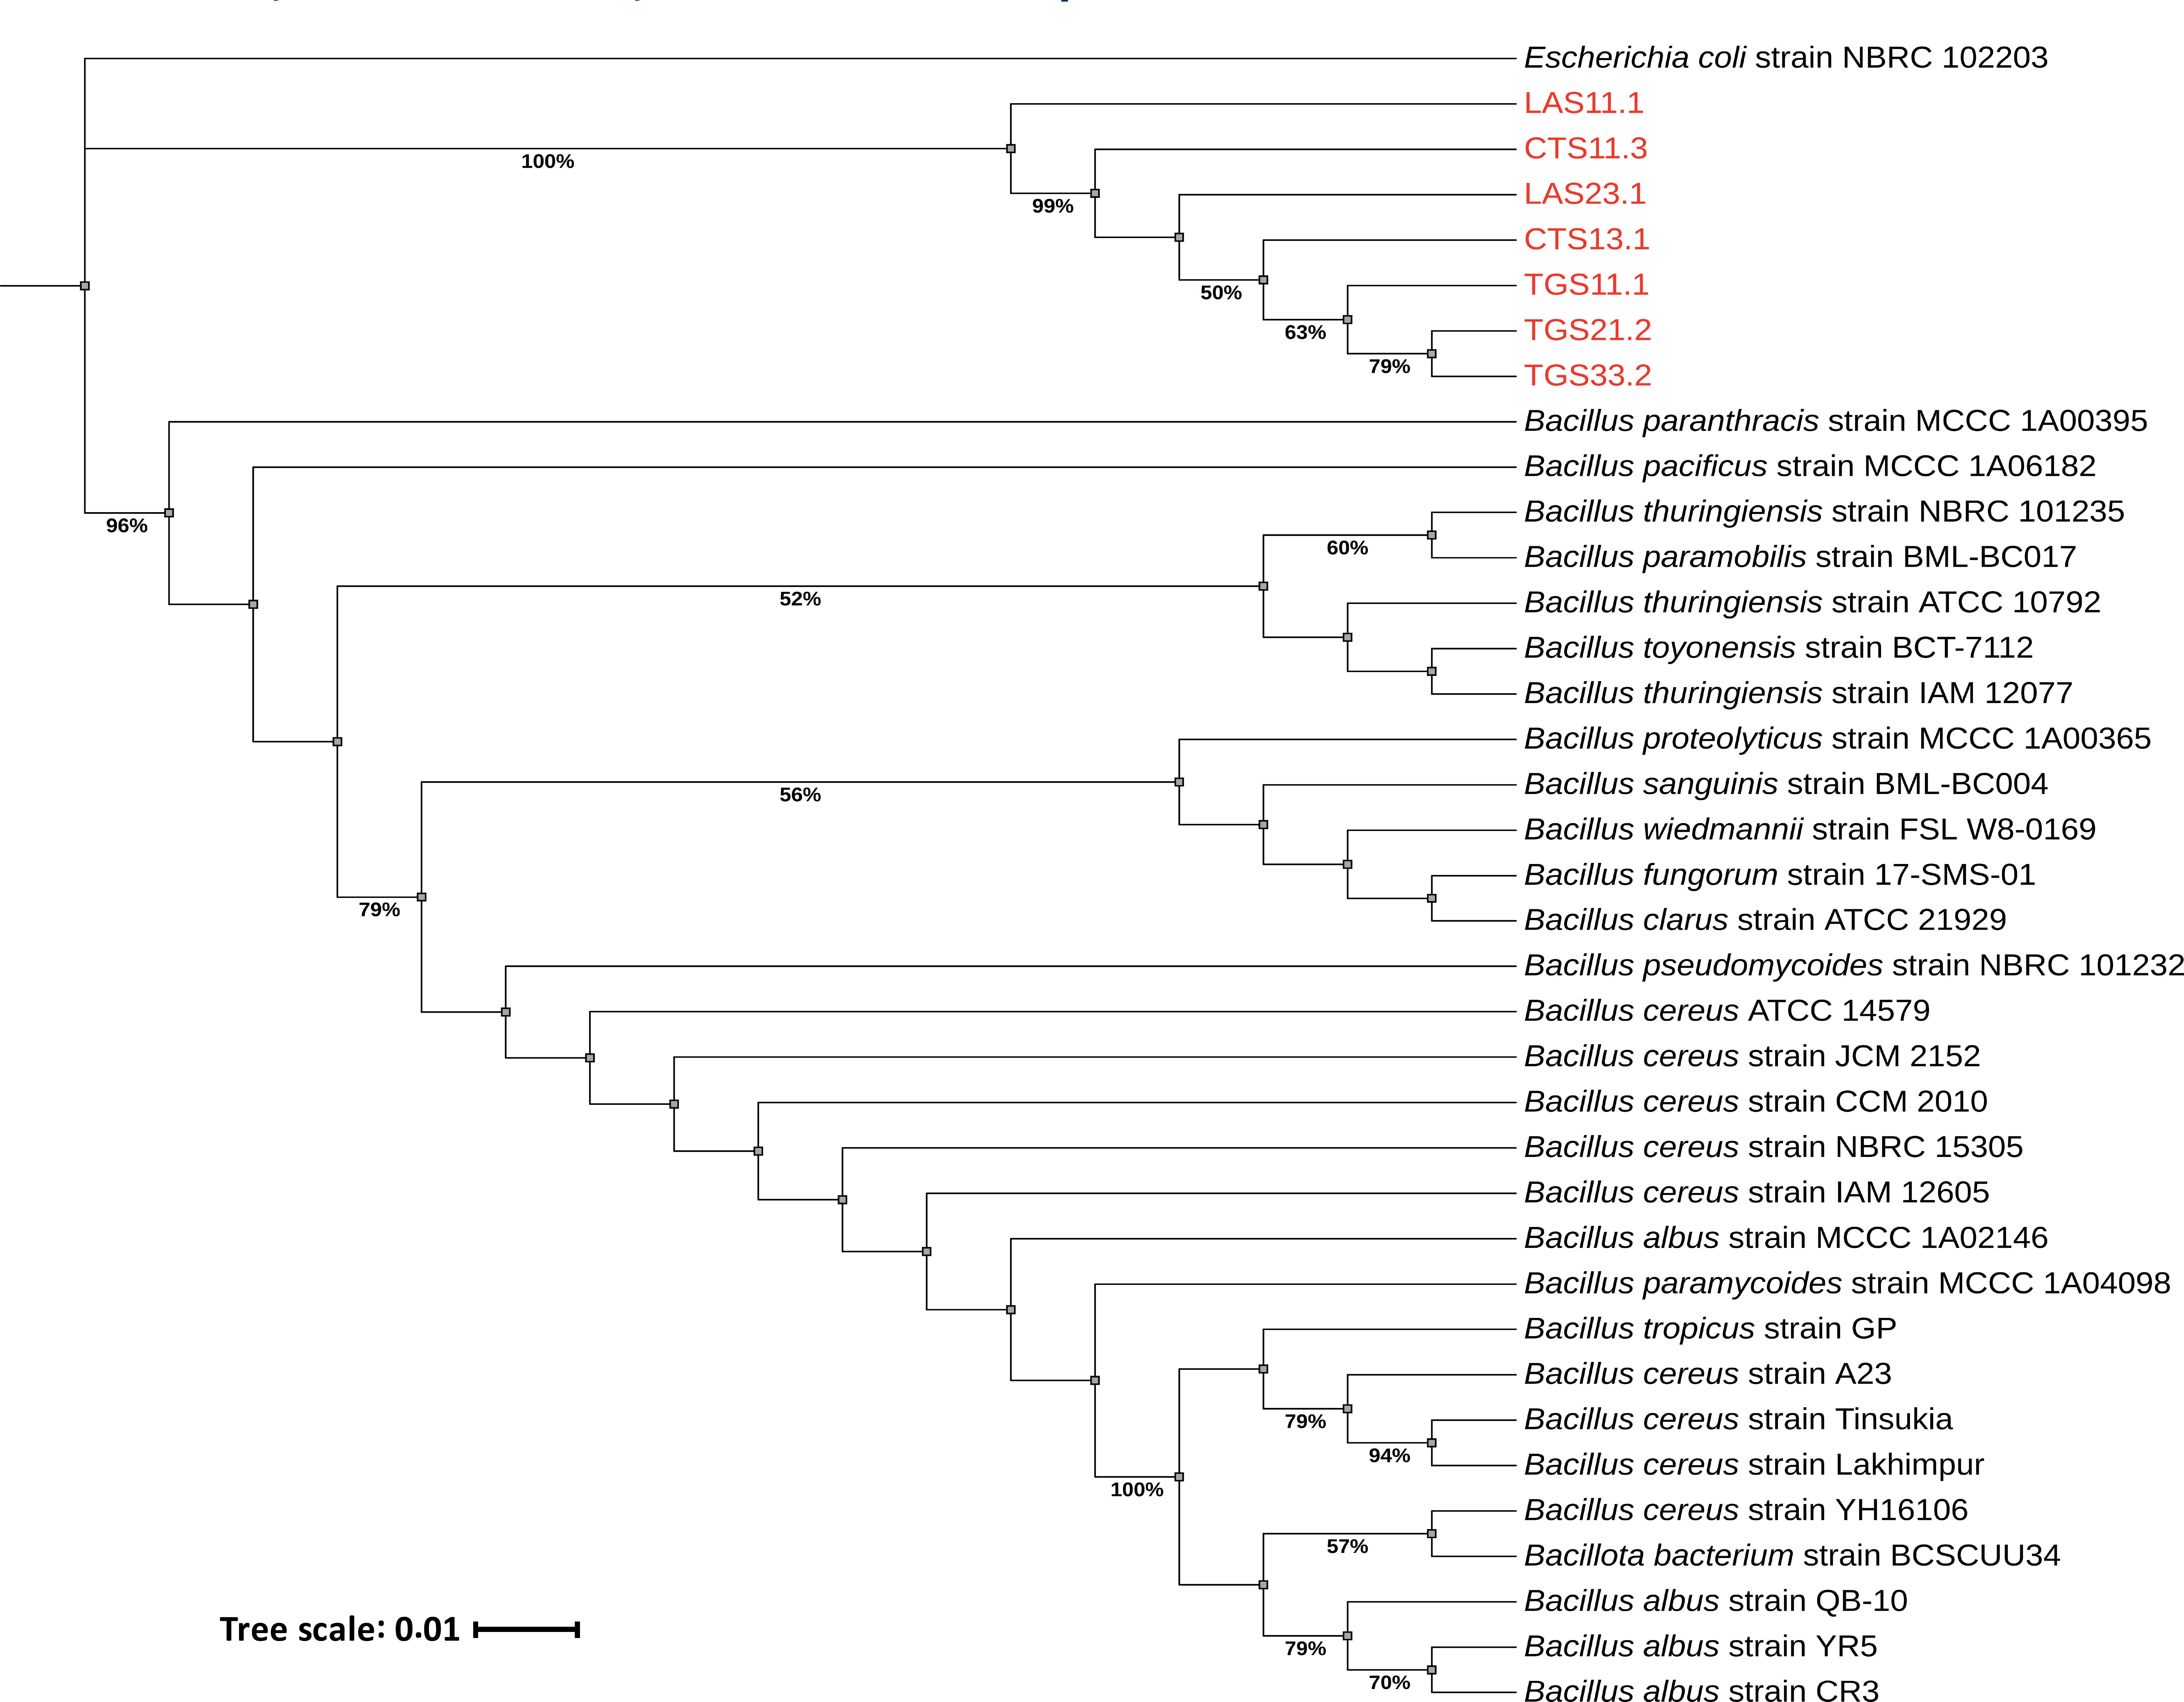
Phylogenetic tree based on 16S rRNA gene sequences showing relationships between the studied Bacillus isolates and closely related reference strains. Bootstrap values (%) are indicated at branch nodes. Escherichia coli NBRC 102203 was used as the outgroup. Isolates obtained in this study are highlighted in red.
CONCLUSION
This study identified Bacillus strain TGS11.1 as a prominent isolate exhibiting both the highest thermotolerance (D95 = 11.37 min) and the strongest biofilm-forming capacity among strains phylogenetically related to the Bacillus cereus group. A strong positive correlation between biofilm formation (OD570) and thermal resistance (D95) was confirmed (r = 0.938; p = 0.00174), indicating that the extent of biofilm development significantly contributes to the thermal survival capacity of bacteria in milk processing environments. This correlation is of considerable practical relevance, as biofilm quantification may serve as a rapid predictive indicator of heat resistance among dairy-associated Bacillus isolates. To mitigate this dual threat, several interconnected control strategies must be considered. First, regarding thermal processing, the application of Ultra-High Temperature (UHT) treatment is recommended over prolonged conventional pasteurization, as it ensures effective inactivation of heat-resistant strains without compromising product quality. Second, stringent control of the initial bacterial load in raw milk is equally critical, given that higher cell densities have been associated with increased heat tolerance and enhanced biofilm development. Maintaining raw milk counts below established microbiological thresholds, prior to processing, substantially reduces post-treatment contamination risk. Third, periodic and systematic sanitation of processing equipment, including pipelines, heat exchangers, and storage tanks, should be enforced through validated Clean-In-Place (CIP) protocols. Finally, the integration of these measures within a comprehensive food safety management framework, specifically HACCP critical control points and ISO 22000:2018 standards, provides the systematic oversight necessary to monitor and control high-risk strains throughout the entire dairy production chain. However, this study has certain limitations. While 16S rRNA sequencing confirmed the genus-level identity, it provided insufficient resolution to definitively distinguish between closely related species within the B. cereus group. Additionally, as the experiments were conducted under controlled laboratory conditions, the practical efficacy of the proposed multi-layered control strategies requires further validation in large-scale industrial dairy environments.
AUTHORS' CONTRIBUTIONS
The authors confirm their contributions to this paper as follows: B.V.: Responsible for the conception and design of the study; B.H.B.T.: Performed experiments, contributed to methodology, and participated in manuscript revision; T.H.T.H.: Responsible for data collection, statistical analysis, and participated in manuscript revision; T.V.B.: Contributed to data analysis and assisted in manuscript revision.; T.K.D.H.: Provided support with equipment and infrastructure for the experiments; K.A.T: Supervised the project and provided critical review.
LIST OF ABBREVIATIONS
| BHI | = Brain Heart Infusion |
| CCPs | = Critical Control Points |
| CFU | = Colony Forming Unit |
| CIP | = Clean in Place |
| CV | = Crystal Violet |
| DPA | = Dipicolinic acid |
| DT | = Decimal reduction Time |
| EPS | = Exopolysaccharide |
| LB | = Luria Bertani |
| OD | = Optical Density |
| PBS | = Phosphate Buffered Saline |
| PCA | = Plate Count Agar |
| SASPs | = Small Acid-Soluble Spore Proteins |
| SEM | = Scanning Electron Microscopy |
| Spp. | = species pluralis |
| TSB | = Tryptic Soy Broth |
| UHT | = Ultra-High Temperature processing |
| Y | = Yeast |
AVAILABILITY OF DATA AND MATERIALS
The data supporting the findings of the article is available from the corresponding authors [B.V. and B.H.B.T] upon reasonable request.
ACKNOWLEDGEMENTS
The authors would like to express their sincere gratitude to the Institute of Advanced Technology, Vietnam, and the Academy of Science and Technology, Vietnam, for providing the laboratory facilities and technical support necessary to conduct this research.