All published articles of this journal are available on ScienceDirect.

Physicochemical Properties and Microbial Quality of Water Used in Selected Poultry Farms in the Ashanti Region of Ghana
Authors Info & Affiliations
Abstract
Background:
Water plays an important role in both domestic and commercial settings. However, some physicochemical properties and biological contaminants could render water unsafe for use. Contaminated water from various sources is used as drinking water and for processing of animal products in animal farms, which has resulted in infections among animals, including poultry, and contaminated animal products on the market.
Objective:
To determine the physicochemical properties and microbial quality of water used as drinking water in selected poultry farms in the Ashanti region of Ghana.
Methods:
The pH, turbidity, conductivity, Total Dissolved Solids (TDS) and total hardness of poultry-drinking-water from 100 farms were assessed following WHO guidelines. The presence of total coliforms and faecal Enterococci was determined using the membrane filtration method. The presence of Escherichia coli, Salmonella typhi, Staphylococcus aureus and coagulase-negative Staphylococci were determined using selective culture media and their identities confirmed using biochemical tests.
Results:
pH of the samples ranged from 3.76 to 8.90, turbidity from 0.20 to 617 NTU, conductivity from 23.6 to 1114.0 µS/cm, TDS from 11.3 to 557 mg/L and total hardness from 17.1 to 192.0. Total coliforms and faecal Enterococci were present in 97% and 56% samples respectively. Escherichia coli, Salmonella typhi, Staphylococcus aureus and non-coagulase staphylococci were isolated from four samples.
Conclusion:
Water used on poultry farms has varied physicochemical properties and could also be a potential source of pathogenic organisms. There should be regular monitoring and checks on the quality of water used in animal husbandry in order to prevent the use of contaminated water for drinking and processing of animal products.
1. INTRODUCTION
Water is one of the most important and abundant resources on earth [1]. It is however estimated that about 1.1 billion people globally are unable to access safe drinking water. This has necessitated various governmental and non-governmental organizations to put in efforts in the provision of safe and quality water [2]. The development of water resources has often been used as an indicator for socio-economic and health status of many nations worldwide [3]. The uses of water in agriculture include for drinking purposes in animal husbandry and also for processing of animal products. The poultry industry in Ghana is quite vibrant with many Ghanaians producing poultry and its by products at a commercial scale. Over 60% of Ghanaian poultry farms are distributed within the Brong-Ahafo, Ashanti and the Greater Accra regions of Ghana [4]. Most of these poultry farms rely on groundwater (boreholes and wells) as their main source of water supply for the poultry birds and other poultry processing purposes on the farms [5]. Water could, however, serve as a reservoir for numerous microorganisms including pathogenic organisms [6]. Viral particles of avian H7 influenza viruses were identified in the serum of farm workers exposed to poultry birds infected with the viral particles in Italy, between the years 1999 and 2003 [7].
It is important to identify the possible source of the infection so as to devise measures and strategies to control the transmission of the disease. Possible sources of infections in the poultry may include farm workers, water used to feed the birds and to prepare the poultry birds and its byproducts for sale, poultry feed and feeding equipment and poultry litter. Most of these infectious agents have been identified in the litter of poultry birds and a report indicates that these agents might have at one point in time inhabited the gastrointestinal tract of the birds [5]. Various microbial agents have been identified in groundwater (boreholes and wells) used for drinking purposes in some communities of Kumasi and in sachet water sold on the streets [8, 9], but very few studies have reported on the quality of water used on poultry farms. This study determines the physicochemical properties and microbial quality of water used for drinking purposes in selected poultry farms located in the Ashanti region of Ghana.
2. MATERIALS AND METHODS
2.1. Selection of Farms
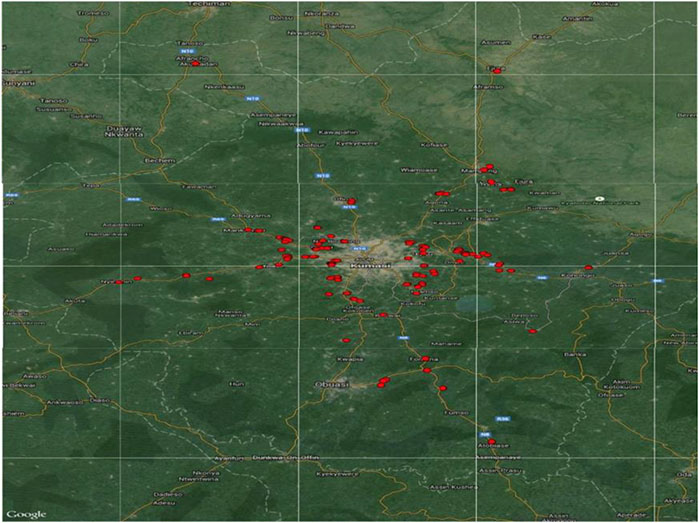
Purposive sampling technique was employed in the selection of the 100 poultry farms out of the total estimated number of 820 poultry farms in the Ashanti region of Ghana (Fig. 1). Farms having bird sizes of 500 or more were included in the study.
2.2. Sampling of Water from Poultry Farms
Samples from pipes and boreholes were allowed to run for about 30 sec and were then used to rinse sterilized bottles twice, before they were aseptically collected into sterilized 500 mL plastic bottles. Water samples from wells were sampled with ropes attached to containers after which they were aseptically transferred into sterilized 500 mL bottles and closed. With stream water sampling, the 500 mL bottle was used to fetch the water from the stream and then immediately covered. The bottles were filled with water samples, leaving an approximately 3 cm space at the top for aeration, and then transported on ice, stored at -4˚C. Samples were collected between 7:00 am to 11:00 am according to the World Health Organization (WHO) guidelines [10] and transported to the laboratory on ice.
2.3. Determination of Physicochemical Properties
The pH, total dissolved solids and conductivity of the collected samples (50 mL of water each) were determined using pH/ total dissolved solids/ conductivity meter as described by WHO [10]. Turbidity of 10 mL of water sample was determined using a turbidimeter as described by WHO [10]. Titration method involving 0.1 M EthylenediamineTetraacetic Acid (EDTA) with 25 mL of water sample and eriochrome black T indicator (Sigma-Aldrich, Steinheim, Germany) was used to determine the hardness of the water samples [10].
2.4. Detection of Total Coliforms and Faecal Enterococci
The total number of coliforms and faecal Enterococci in the samples were determined by the filtration of 100 mL of the sample using 0.45 µm pore size membrane filter. The filter plus its contents were then placed on 20 mL lauryl sulphate agar (Oxoid, London, UK) and incubated at 37˚C for 24 h. For the determination of the faecal Enterococci in the samples, the filter and its content were placed on 20 mL Slanetz and Bartley’s agar (Oxoid, London, UK) and incubated at 44˚C for 24 h [10].
2.5. Isolation of Bacterial Contaminants
Organisms present in the sample were revived by inoculating 1 mL of the water samples overnight in 10 mL nutrient broth (Oxoid, London, UK) and incubated at 37˚C. For the isolation of Escherichia coli from the samples, 1 mL of the broth culture was inoculated into 20 mL MacConkey agar (Oxoid, London, UK) and incubated at 37˚C for 24h. Presumptive E. coli colonies (violet-red colonies with bile deposits) were selected and confirmed through Gram-staining, catalase activity in 3% hydrogen peroxide solution, indole production in tryptone water, citrate utilization and Methyl Red-Voges-Proskauer (MRVP) tests [11]. For the isolation of Salmonella typhi from the samples, 1 mL of the broth culture of each incubated sample was inoculated into 20 mL bismuth sulphite agar and incubated at 37˚C for 24 h. Presumptive S. typhi colonies (black shiny rabbit-eye colonies) were selected and confirmed through Gram-staining, hydrogen-sulphide production in peptone water, indole production in tryptone water, citrate utilization and catalase activity in 3% hydrogen peroxide solution [11].
For the isolation of Staphylococci from the samples, 1 mL of the broth culture of each sample was inoculated into 20 mL mannitol salt agar (Oxoid, London, UK) and incubated at 37˚C for 24 h. Presumptive S. aureus colonies (bright-yellowish colonies) and coagulase-negative Staphylococci colonies (reddish colonies) were selected and confirmed through Gram-staining, catalase activity in 3% hydrogen peroxide solution, tube coagulase test and haemolysis on blood agar [11].
3. RESULTS
3.1. Sources of Water
From the 100 poultry farms sampled, 35% of farms used borehole water, 33% well water, 31% tap water, and only one farm used stream water as their main water source.
3.2. Physicochemical Properties
3.2.1. pH
The pH ranged from 3.76 to 8.90 for the 100 samples with a mean of 6.03. Sixty-two samples (62%) were acidic with pH less than 6.5, whereas 1% of sample had pH greater than 8.5. The remaining 37% of samples had pH values within the range of 6.5 to 8.5. The 62 samples that had pH below 6.5 included 26% from tap water, 21% from well water and 15% from borehole water. One well water sample had pH above 8.5. The 37% of samples that had suitable and acceptable pH included 20% from borehole water, 11% from well water, 5% from tap water and 1% stream water (Table 1).
3.2.2. Turbidity
The WHO recommends that the turbidity of drinking water should not be above 5 NTU [10]. The turbidity values of the samples ranged from 0.20 to 617 NTU with a mean of 9.4 NTU. Thirteen (13%) samples had turbidity values greater than 5 NTU, whilst 87% of the samples had values less than 5 NTU. The samples that had turbidity greater than 5 NTU included 5% of the samples each from well water and borehole water and 3% from tap water. Eighty-seven samples that had turbidity less than 5 NTU included 30% from borehole water, 28% each from well and tap water, and 1% from stream water (Table 1).
3.2.3. Conductivity
The WHO recommends that the conductivity of drinking water should not be above 400 µS/cm [10]. The conductivities of the 100 samples ranged from 23.6 to 1114.0 µS/cm with a mean of 146.7 µS/cm. Ninety-six (96%) of the water samples had conductivities less than 400 µS/cm whereas 4% of the samples had conductivities above 400 µS/cm. The samples that had conductivities less than 400 µS/cm included 33% from well water, 32% from borehole water, 30% from tap water and 1% stream water. Three water samples (3% of the total samples) from borehole and one (1%) from tap water had conductivities above 400 µS/cm (Table 1).
3.2.4. Total Dissolved Solids (TDS)
The WHO recommends that the TDS of drinking water should not be above 500 mg/ L [10]. The values for the total dissolved solids of the samples ranged from 11.3 to 557 mg/L with a mean of 73.3 mg/ L. Ninety-nine samples (99%) had total dissolved solids less than 500 mg/L whilst 1% had total dissolved solids more than 500 mg/L. One percent of the tap water had total dissolved solids above 500 mg/ L (Table 1).
| Physicochemical Property |
Mean ± SD | Category/Reference Standard | Number of Samples Per Source of Water | |||
|---|---|---|---|---|---|---|
| Tap Stream Well Borehole | ||||||
| (n=31) (n=1) (n=33) (n=35) | ||||||
| pH | 6.03±1.07 | Below 6.5 6.5-8.5 Above 8.5 |
15 | 0 | 21 | 26 |
| 20 | 1 | 11 | 5 | |||
| 0 | 0 | 1 | 0 | |||
| Turbidity (NTU) |
9.5±61.8 | Below 5 Above 5 |
28 | 1 | 28 | 30 |
| 3 | 0 | 5 | 5 | |||
| Conductivity (µS/cm) |
146.7±140.4 | Below 400 Above 400 |
30 | 1 | 33 | 32 |
| 1 | 0 | 0 | 3 | |||
| TDS (mg/L) |
73.3±70.2 | Below 500 Above 500 |
30 | 1 | 33 | 35 |
| 1 | 0 | 0 | 0 | |||
| Total hardness (mg/L) |
64.6±70.3 | 17.1 - 60 | 17 | 0 | 21 | 19 |
| 60 - 120 | 13 | 1 | 10 | 16 | ||
| Above 180 | 1 | 0 | 2 | 0 | ||
| Isolate | Sources of Water | |||||||||||
|---|---|---|---|---|---|---|---|---|---|---|---|---|
| Stream (n=1) | Tap (n=31) | Well (n=33) | Borehole (n=35) | |||||||||
| N | %a | %b | N | %a | %b | N | %a | %b | N | %a | %b | |
| E. coli | 0 | 0 | 0 | 7 | 22.6 | 7 | 12 | 36.4 | 12 | 12 | 34.3 | 12 |
| S. typhi | 1 | 100 | 1 | 11 | 35.5 | 11 | 13 | 39.4 | 13 | 11 | 31.4 | 11 |
| S. aureus | 1 | 100 | 1 | 20 | 64.5 | 20 | 22 | 66.7 | 22 | 21 | 60 | 21 |
| CoNS | 0 | 0 | 0 | 6 | 19.4 | 6 | 8 | 24.2 | 8 | 5 | 14.3 | 5 |
| Faecal Enterococci | 0 | 0 | 0 | 14 | 45.2 | 14 | 16 | 48.5 | 16 | 26 | 74.3 | 26 |
| Total coliforms | 1 | 100 | 1 | 30 | 96.8 | 30 | 33 | 100 | 33 | 33 | 94.3 | 33 |
3.2.5. Total Hardness
The WHO grades drinking water as soft (values below 17.1 mg/ L), slightly hard (with values between 17.1 and 60 mg/L), moderately hard (with values between 60 and 120 mg/L), hard (with values between 120 and 180 mg/L) and very hard (values greater than 180 mg/L) [10]. The total hardness of the samples ranged between 17.1 and 180 mg/L with a mean of 64.6 mg/ L. Fifty-eight samples (58%) were slightly hard, including 21% of the samples from well water sources, 20% from borehole sources and 17% from tap water sources. Thirty-nine (39%) samples were moderately hard, including 16% of the samples from borehole sources, 13% from tap water sources, 9% from well water sources and 1% from stream water source (Table 1).
3.3. Microbial Contaminants
3.3.1. Total Coliforms
The WHO recommends that there should be no coliforms in drinking water per 100 mL of water [10]. Ninety-seven (97%) of the samples were contaminated with total coliforms. Of the 97 samples contaminated, 33% were from well and borehole water sources, 30% from tap water and 1% from stream water. The 3 water samples that were not contaminated with coliforms included 2 from borehole sources and 1 from a tap water source (Table 2).
3.3.2. Faecal Enterococci
The WHO recommends that there should be no faecal Enterococci in 100 mL of drinking water [10]. Fifty-six (56%) water samples were contaminated with faecal Enterococci. These comprised 26% of the samples from borehole sources, 16% from well water sources and 14% from tap water sources. The 44 samples that were not contaminated with faecal Enterococci included 17 samples each from tap water and well water sources (Table 2).
3.3.3. Presence of Escherichia coli, Salmonella typhi, Staphylococcus aureus and Coagulase-negative Staphylococci
From the 100 samples analysed, 31% were contaminated with E. coli. Twelve (38.71%) of these isolates were each obtained from the well and borehole water sources respectively, and 22.58% obtained from tap water sources (Table 2). S. aureus was isolated from 64% of the samples, with 34.38% from well water sources, 32.81% from borehole sources and 31.25% from tap water sources (Table 2). Thirty-six percent of the samples had S. typhi isolates. These included 36.11% from well water sources and 30.56% each from borehole and tap water sources (Table 2). Nineteen percent of the samples had coagulase-negative Staphylococci (including S. saprophyticus, S. haemolyticus, S. lugdunensis and S. schleiferi). These included 8 (42.11%) from well water sources, 6 (31.8%) from tap water sources and 5 (26.32%) from borehole sources (Table 2).
| Contaminants (Frequency) |
N | Percentage of Samples Per Source of Water | |||
|---|---|---|---|---|---|
| Well | Stream | Tap | Borehole | ||
| EC only | 8 | 0 | 0 | 9.7 | 8.6 |
| SA only | 25 | 18.2 | 0 | 29.0 | 28.6 |
| ST only | 3 | 6.1 | 0 | 0 | 2.9 |
| CoNS only | 8 | 12.1 | 0 | 9.7 | 2.9 |
| EC/ ST | 1 | 0 | 0 | 0 | 2.9 |
| EC/ SA | 8 | 19.4 | 0 | 0 | 5.7 |
| EC/ CoNS | 4 | 6.1 | 0 | 3.2 | 2.9 |
| ST/ SA | 18 | 15.2 | 100 | 25.8 | 11.4 |
| ST/ CoNS | 2 | 3 | 0 | 0 | 2.9 |
| SA/ CoNS | 3 | 0 | 0 | 3.2 | 5.7 |
| EC/ ST/ SA | 8 | 9.1 | 0 | 6.5 | 8.6 |
| EC/ ST/ CoNS | 1 | 0 | 0 | 3.2 | 0 |
| ST/ SA/ CoNS | 1 | 3.0 | 0 | 0 | 0 |
| EC/ ST/ SA/ CoNS | 1 | 3.0 | 0 | 0 | 0 |
3.4. Level of Microbial Contamination
3.4.1. Contamination with One Bacterial Isolate
Forty-four (44%) samples were contaminated with 1 of the 4 isolated bacteria, which included 18 (18%) borehole samples, 15 (15%) samples from tap water and 11 (11%) from well water. Twenty-five (25%) samples were contaminated with S. aureus, 8 (8%) with each of E. coli and coagulase-negative Staphylococci and 3 (3%) with S. typhi (Table 3).
3.4.2. Contamination with Two Bacterial Isolates
Thirty-six (36%) samples were contaminated with 2 of the 4 isolated bacteria. This comprised 14 (14%) samples from well water, 11 (11%) samples from borehole, 10 (10%) samples from tap water and 1 (1%) stream water sample. S. aureus and S. typhi, S. aureus and E. coli, E. coli and coagulase-negative Staphylococci, S. aureus and coagulase-negative Staphylococci, coagulase-negative Staphylococci and S. typhi. E. coli and S. typhi were isolated from 18, 8, 4, 3, 2 and 1% of the samples, respectively (Table 3).
3.4.3. Contamination with Three Bacterial Isolates
Ten (10%) water samples were contaminated with 3 of the 4 isolated bacteria. The 10 samples included 4 (4%) samples from well water sources and 3 (3%) samples each from tap water and borehole sources. Eight (80%) samples were contaminated with S. aureus, E. coli and S. typhi isolates. One sample was contaminated with S. aureus, S. typhi, coagulase-negative Staphylococci and E. coli, S. typhi, coagulase-negative Staphylococci. Only one water sample was contaminated with all 4 isolated microorganisms (Table 3).
4. DISCUSSION
Quality of water for drinking purposes is a major health determinant for consumers and the health implications of water may stem from both its physicochemical and microbiological parameters. The ubiquitous nature of microorganisms accounts for their easy contamination of substances (including water) that are used by both humans and non-humans. Depending on the virulent abilities of these contaminants, various infections may arise [12]. These infectious agents could also be responsible for drug-resistant infections, which is of great concern [13].
The majority of poultry farms were dependent on borehole as a major source of water. Physicochemical parameters assessed included pH, turbidity, electrical conductivity, total dissolved solids and total hardness of the water samples. Values that fall below or above acceptable limits mostly lead to appearance and taste challenges and problems [10]. The pH of water measures its degree of acidity or alkalinity due to dissolved ions [14]. Most of the water samples were acidic which could lead to gastrointestinal tract problems in both humans and animals [10]. The majority of borehole water samples had values within acceptable limits for drinking water (Table 1).
Turbidity of water measures the degree to which water loses its transparency due to the presence of suspended particles. These suspended particles could serve as reservoirs for viruses and bacteria which can pose a health hazard [16]. From the study, 13% of water used on poultry farms had turbidity values greater than 5 NTU with a mean of 9.5 NTU (Table 1). This implies that some water used at the poultry farms acts as potential habitat for pathogenic organisms, due to high levels of suspended particles [16]. The high average turbidity can be attributed to sediments of soil and plants as well as to the shallow nature of some water bodies, which could lead to the acquisition of suspended particles [16].
Total dissolved solids in water measures the combined content of inorganic and organic substances confined in molecular, ionic and micro-granular suspended forms. Effects of total dissolved solids in water gives an indication of the presence of a wide range of chemicals in the water [10]. All samples but one had total dissolved solids above acceptable limits by the WHO [10], indicating that they are unsuitable as drinking water. This could be attributed to the geological properties of the sampling sites [15]. The low electrical conductivity recorded in this study could be attributed to low mineralization [17]. All but 4 samples had conductivities above acceptable range by the WHO [10]. This could be attributed to their high content of total dissolved solids which is directly proportional to conductivity [17]. The high amounts of calcium and magnesium complexes in hard water provides some health benefits including enhancing bone strength and density [10]. The total hardness of the water samples ranged from 26 to 520 mg/L, with an average of 64.6 mg/L (Table 1), which could be attributed to low mineral content in the water samples [17].
Microorganisms in drinking water pose a high risk of waterborne gastroenteritis [18]. E. coli, S. typhi, S. aureus and coagulase-negative Staphylococci were isolated (Table 2) with S. aureus identified as the predominant microbial bacterial agent, which has been found to cause septicaemia in poultry birds, leading to low body weight and high mortality. The microbial contamination may be as a result of improper storage of the water sample. Coliform bacteria contamination in well water samples can arise from sewage treatment plants that are closely located to wells. Wells constructed closer to surface drainage water could be easily contaminated by such microorganisms [19]. Wells having no covers or having covers with cracks could also be easily contaminated. Lapses in water treatment procedures and possible leakages could contribute to such occurrence in tap and borehole samples, respectively [19]. These observations may be responsible for contamination of water bodies by organic and faecal matter in addition to the poor design or location of these water bodies, making them exposed to surface draining systems, as well as the lack of proper water treatment mechanisms in such underground water [19]. From the above findings, there is an urgent need for the strict monitoring of the microbial quality and physicochemical properties of the various sources of water used in animal husbandry in Ghana.
CONCLUSION
Most poultry farms in the Ashanti region rely on borehole water as their main source of water, followed by well and tap water, which have good physicochemical properties. Most of the water samples were contaminated with coliform and Enterococcal bacteria and coagulase-negative Staphylococci, with S. aureus being the predominant isolate. There is a need for regular monitoring of the quality of water used in these farms to reduce or prevent the use of contaminated water for drinking and processing of animal products.
ETHICS APPROVAL AND CONSENT TO PARTICIPATE
Not applicable.
HUMAN AND ANIMAL RIGHTS
No animals/humans were used for studies that are the basis of this research.
CONSENT FOR PUBLICATION
Not applicable.
AVAILABILITY OF DATA AND MATERIALS
The data for study is available at the Microbiology Section, Department of Pharmaceutics, Kwame Nkrumah University of Science and Technology, Kumasi, Ghana.
FUNDING
The project is funded under Safe Water for Food and the funding agency reference number is 11-058DHI DANIDA.
CONFLICT OF INTEREST
The authors declares no conflict of interest, financial or otherwise.
ACKNOWLEDGEMENTS
We are grateful to the workers, managers and owners of poultry farms and the officials of Veterinary Section of Ministry of Food and Agriculture in the Ashanti region of Ghana for the support and cooperation during the project.