All published articles of this journal are available on ScienceDirect.

Phenotypic and Genotypic Characterization of Escherichia coli Isolated from Untreated Surface Waters
Authors Info & Affiliations
Abstract
A common member of the intestinal microbiota in humans and animals is Escherichia coli. Based on the presence of virulence factors, E. coli can be potentially pathogenic. The focus of this study was to isolate E. coli from untreated surface waters (37 sites) in Illinois and Missouri and determine phenotypic and genotypic diversity among isolates. Water samples positive for fecal coliforms based on the Colisure® test were streaked directly onto Eosin Methylene Blue (EMB) agar (37°C) or transferred to EC broth (44.5°C). EC broth cultures producing gas were then streaked onto EMB agar. Forty-five isolates were identified as E. coli using API 20E and Enterotube II identification systems, and some phenotypic variation was observed in metabolism and fermentation. Antibiotic susceptibility of each isolate was also determined using the Kirby-Bauer Method. Differential responses to 10 antimicrobial agents were seen with 7, 16, 2, and 9 of the isolates resistant to ampicillin, cephalothin, tetracycline, and triple sulfonamide, respectively. All of the isolates were susceptible or intermediate to amoxicillin, ciprofloxacin, polymyxin B, gentamicin, imipenem, and nalidixic acid. Genotypic variation was assessed through multiplex Polymerase Chain Reaction for four virulence genes (stx1 and stx2 [shiga toxin], eaeA [intimin]; and hlyA [enterohemolysin]) and one housekeeping gene (uidA [β-D-glucuronidase]). Genotypic variation was observed with two of the isolates possessing the virulence gene (eaeA) for intimin. These findings increase our understanding of the diversity of E. coli in the environment which will ultimately help in the assessment of this organism and its role in public health.
INTRODUCTION
Escherichia coli is a Gram-negative enteric species that contains both commensal and pathogenic members [1]. Among the pathogenic strains, the shiga-toxin producing variants (STEC) account for an approximately 73,000 annual cases of reported human illnesses in the United States in an estimate made in 2002 [2]. The pathogenic forms are typically disseminated via incorrectly prepared food items, including ground beef products and produce, or contaminated water sources, including potable and recreational waters [3-5]. In addition to its role in human diseases, E. coli is also the preferred indicator organism for fecal contamination because it is the only member of the coliform group that is always tied to fecal matter from warm-blooded animals [6].
The Environmental Protection Agency’s data reviewed by Macler and Merkle [7] showed that 40,000 out of 156,000 ground water systems in the United States examined by either total coliform or fecal coliform count have exceeded the mandated level of Total Coliform Rule maximum. The presence of coliforms in over 25% of groundwater systems suggests that there is a widespread dissemination of enteric organisms in the environment. The typical sources of these contaminations include concentrated point sources (e.g. defective septic systems, leaky sewer lines, and discharges from wastewater treatment plants) and non-point sources (e.g. runoff from livestock farming and urban and rural runoff containing feces from companion animals or wildlife). After E. coli enters the water system, its dissemination is dependent on various geohydrological factors, such as the amount of particulates and the flow rate [8]. Recent studies have shown that once present in the environment, E. coli is capable of persisting and replicating under many different conditions [9]. In particular, when the environment is enriched with fecal material, E. coli is apparently able to flourish in localized areas and persist [10, 11]. The presence and persistence of E. coli in the environment raise significant concerns in tracking the dissemination pattern and following up on source-tracking efforts during disease outbreaks because they act as multiple reservoirs where rainfall or irrigation can serve to re-introduce fecal contaminants into the surrounding. As a result of this characteristic of E. coli, there is also concern about the spread of antibiotic resistance. In a study of water sources associated with an area with cattle farming, 24% of the 600 isolates tested showed antibiotic resistance to at least one antimicrobial agent, and many were resistant to more than one [12]. In a different study that examined the Karstic aquifers in France, the percentage of E. coli isolates that showed antibiotic resistance to at least one antimicrobial agent ranged from 17 to 70%, depending on the rainfall and seasonal factors [13].
Taken together, the presence of E. coli in the environment poses both immediate concerns due to the widespread cases of disease outbreaks associated with water sources contaminated with pathogenic variants of E. coli, as well as a long-term concern over the persistence of this organism as it relates to the spreading of antibiotic resistance. Therefore, a better understanding of the characteristics of E. coli in surface water sources will be beneficial in order to manage public health concerns and shed light on the dynamic nature of the underlying processes governing the distribution and persistence of this organism in our environment. In this study, surface water sources in Illinois and Missouri, U.S.A., were surveyed for the presence of E. coli. Isolates that were obtained were then assayed for antibiotic resistance and their genetic makeup on four loci related to pathogenicity was determined using a multiplex PCR procedure.
MATERIALS AND METHODS
Water Collection and Processing
Samples (~100 ml) of untreated surface waters from locations in Illinois and Missouri (see Table 1 for categories and locations of surface waters sampled) were collected directly in sterile 120-ml polystyrene coliform bottles and transported to the laboratory for processing. One packet of Colisure® (IDEXX Laboratories Inc., Westbrook, ME) was added to each collected water sample, thoroughly mixed, and placed in the incubator. Unless noted otherwise, all water samples and broth or agar plate cultures were incubated at 37°C for 24-48 h. Water samples that fluoresced under a long-wave UV light after incubation were scored as positive for fecal coliforms (as stated in the Colisure® instructions) and were used for the isolation and additional testing of E. coli.
Categories, Names, and Locations of Surface Waters that Yielded E. coli Isolates
| Category (Number of Locations Sampled) | Name of Surface Water Sampled | Location | Isolate and Surface Water Abbreviationa | Total Number of Isolates (% of 45 Total) |
|---|---|---|---|---|
| Pond (16) | 18 (40) | |||
| Unique Homes Pond | Charleston, IL | UHP | ||
| House Pond | Coles County, IL | HP | ||
| Esarey's Pond | Charleston, IL | EP | ||
| SBLHC Pond | Sarah Bush Lincoln Health Center, Charleston, IL | SHP-1, SHP-2 | ||
| Turtle Pond | Southern Illinois University, Edwardsville, IL | TP | ||
| Wilderness Pond | Fox Ridge State Park, IL | WP | ||
| KFC Pond | Charleston, IL | KFCP | ||
| Lantz Pond | Eastern Illinois University | LP-1, LP-2 | ||
| Carman Pond | Eastern Illinois University | CP | ||
| Arcola Pond | Arcola, IL | AP | ||
| Wyman Park Pond | Sullivan, IL | WPP | ||
| Aunt's House Pond | Coles County, IL | AHP | ||
| BK Pond | Champaign, Il | BKP | ||
| Farm Pond | Coles County, IL | FP | ||
| Johnson Pond | Elk Grove, IL | JP | ||
| Cougar Trail Prairie Pond | Hoffman Estates, IL | CTPP | ||
| Stream/creek (7) | 11 (24) | |||
| Kickapoo Creek | Charleston, IL | KC | ||
| Spook Road Creek | Charleston, IL | SRC | ||
| Charleston Town Creek | Charleston, IL | CTC-1, CTC-2, CTC-3, CTC-4, CTC-5 | ||
| Bone Yard Creek | University of Illinois, Urbana, IL | BYC | ||
| Waterfowl Area Stream | Sullivan, IL | FAS | ||
| Tabor Park Stream | Sullivan, IL | TPS | ||
| Spring Valley Nature Center Stream | Schaumburg, IL | SVNCS | ||
| Lake (9) | 9 (20) | |||
| Lake Sara | Effingham, IL | LS | ||
| Lake Capaha | Cape Girardeau, MO | LH | ||
| Lake Charleston | Charleston, IL | LC | ||
| Ridge Lake | Fox Ridge State Park, IL | RL | ||
| Dunlap Lake | Edwardsville, IL | DL | ||
| Reasor Park Lake | Charleston, IL | RPL | ||
| Forest Lake North | Libertyville, IL | FLN | ||
| Independence Grove Lake | Libertyville, IL | IGL | ||
| Lake Michigan | Chicago, IL | LM | ||
| River (5) | 7 (16) | |||
| Little Wabash River | Effingham, IL | LWR | ||
| Mississippi River | Cape Girardeau, MO | MRM | ||
| Mississippi River | Alton, IL | MRI | ||
| Embarras River | Coles County, IL | ER-1, ER-2, ER-3 | ||
| Des Plaines River | Libertyville, IL | DPR | ||
a For surface waters that yielded more than one isolate, water samples were collected from those locations at different points and/or at different times and days. In most cases, only one isolate was obtained from each surface water; however, for surface waters (SHP, LP, CTC, and ER) that yielded multiple isolates, the number after the abbreviation represents the isolate number from that particular surface water (e.g., SHP-1).
Primers Used in the Present Studya
| Primer Pair (F = forward, R = reverse) | Gene – Gene Product | Amplicon Size (bp) | Reference |
|---|---|---|---|
| hlyAF; GCATCATCAAGCGTACGTTCC hlyAR; AATGAGCCAAGCTGGTTAAGCT |
Enterohemolysin – cell lysis | 534 | [14] |
| eaeAF; GACCCGGCACAAGCATAAGC eaeAR; CCACCTGCAGCAACAAGAGG |
Intimin – adhesion to epithelial cells, induction of TH1 immune responses | 384 | [14] |
| stx2F; GGCACTGTCTGAAACTGCTCC stx2R; TCGCCAGTTATCTGACATTCTG |
Shiga Toxin type 2 - inhibition of protein synthesis, apoptosis induction | 255 | [14] |
| stx1F; ATAAATCGCCATTCGTTGACTAC stx1R; AGAACGCCCACTGAGATCATC |
Shiga Toxin type 1 - inhibition of protein synthesis, apoptosis induction | 180 | [14] |
| UAL754; AAAACGGCAAGAAAAAGCAG UAR900; ACGCGTGGTTACAGTCTTGCG |
β-glucuronidase – metabolism of 4-methylumbelliferyl-β-D-glucuronide in Colisure | 147 | [15] |
a All primers were purchased from Integrated DNA Technologies, Coralville, Iowa.
Identification (ID) Codes and Responses of Isolates Identified as E. coli based on the API 20E and Enterotube II Test Systems
| ID Codea | Test resultb | ||||||||||||||||||||||||||
|---|---|---|---|---|---|---|---|---|---|---|---|---|---|---|---|---|---|---|---|---|---|---|---|---|---|---|---|
| API 20E | Entero-tube II | Number of Isolates (% of 45 Total) | ONPG | ADH | LDC | ODC | CIT | H2S | URE | TDA | IND | VP | GEL | GLU | MAN | INO | SOR | RHA | SAC | MEL | AMY | ARA | GAS | ADO | DUL | PHE | LAC |
| 5144572 | 19 (42.2) | + | - | + | + | - | - | - | - | + | - | - | + | + | - | + | + | + | + | - | + | ||||||
| 5144552 | 10 (22.2) | + | - | + | + | - | - | - | - | + | - | - | + | + | - | + | + | - | + | - | + | ||||||
| 4144572 | 5 (11.1) | - | - | + | + | - | - | - | - | + | - | - | + | + | - | + | + | + | + | - | + | ||||||
| 5044552 | 4 (8.8) | + | - | + | - | - | - | - | - | + | - | - | + | + | - | + | + | - | + | - | + | ||||||
| 5044572 | 2 (4.4) | + | - | + | - | - | - | - | - | + | - | - | + | + | - | + | + | + | + | - | + | ||||||
| 5144472 | 1 (2.2) | + | - | + | + | - | - | - | - | + | - | - | + | - | - | + | + | + | + | - | + | ||||||
| 5144562 | 1 (2.2) | + | - | + | + | - | - | - | - | + | - | - | + | + | - | + | - | + | + | - | + | ||||||
| 1044552 | 1 (2.2) | + | - | - | - | - | - | - | - | + | - | - | + | + | - | + | + | - | + | - | + | ||||||
| 0044552 | 1 (2.2) | - | - | - | - | - | - | - | - | + | - | - | + | + | - | + | + | - | + | - | + | ||||||
| 5044542 | 1 (2.2) | + | - | + | - | - | - | - | - | + | - | - | + | + | - | + | - | - | + | - | + | ||||||
| 5144552c | E. coli ATCC 25922 | + | - | + | + | - | - | - | - | + | - | - | + | + | - | + | + | - | + | - | + | ||||||
| 36560 | 20 (44.4) | + | + | - | - | - | + | + | + | + | + | - | - | - | + | ||||||||||||
| 36570 | 7 (15.6) | + | + | - | - | - | + | + | + | + | + | - | + | - | + | ||||||||||||
| 26570 | 5 (11.1) | + | + | - | - | - | + | + | + | + | - | - | + | - | + | ||||||||||||
| 26560 | 4 (8.8) | + | + | - | - | - | + | + | + | + | - | - | - | - | + | ||||||||||||
| 34570 | 3 (6.7) | + | - | - | - | - | + | + | + | + | + | - | + | - | + | ||||||||||||
| 34560 | 2 (4.4) | + | - | - | - | - | + | + | + | + | + | - | - | - | + | ||||||||||||
| 24560 | 1 (2.2) | + | - | - | - | - | + | + | + | + | - | - | - | - | + | ||||||||||||
| 34760 | 1 (2.2) | + | - | - | - | - | + | + | + | + | + | + | - | - | + | ||||||||||||
| 30560 | 1 (2.2) | - | - | - | - | - | + | + | + | + | + | - | - | - | + | ||||||||||||
| 30570 | 1 (2.2) | - | - | - | - | - | + | + | + | + | + | - | + | - | + | ||||||||||||
| 36560c | E. coli ATCC 25922 | + | + | - | - | - | + | + | + | + | + | - | - | - | + | ||||||||||||
a All codes listed identified isolates as E. coli.
b Biochemical tests: ONPG, 2-nitrophenyl-β-D-galactopyranoside to detect β-galactosidase; ADH, arginine dihydrolase; LDC, lysine decarboxylase; ODC, ornithine decarboxylase; CIT, citrate utilization; H2S, H2S production; URE, urease; TDA, tryptophan deaminase; IND, indole production; VP, Voges-Proskauer test for acetoin; GEL, gelatinase; GLU, glucose fermentation; MAN, mannitol fermentation; INO, inositol fermentation; SOR, sorbitol fermentation; RHA, rhamnose fermentation; SAC, saccharose (sucrose) fermentation; MEL, melibiose fermentation; AMY, amygdalin fermentation; ARA, arabinose fermentation; GAS, gas production; ADO, adonitol fermentation; DUL, dulcitol fermentation; PHE, phenylalanine deaminase; LAC, lactose fermentation. Red shaded areas indicate tests that were different from E. coli ATCC 25922, the control (reference) strain.
c API 20E and Enterotube II test results for E. coli ATCC 25922.
Barcodes as an Indication of Phenotypic Diversity Among Isolates of E. coli Recovered from Different Surface Waters
| Barcodea | Number of Isolates Per Barcode (% of 45 Total) | Isolate and Surface Water that Yielded Observed Barcode (Phenotype)b | |||
|---|---|---|---|---|---|
| Pond | Stream/creek | Lake | River | ||
| 5144572-36560 | 11(24.4) | SHP-1 BKP |
SRC CTC-1 |
DL IGL FLN RPL |
DPR ER-1 LWR |
| 5144552-36560 | 7 (15.6) | UHP EP AP |
FAS KC |
RL | ER-2 |
| 4144572-36570 | 4 (8.9) | CTC-2 CTC-3 |
LH LS |
||
| 5144572-36570 | 3(6.7) | LP-1 LP-2 WP |
|||
| 5144572-26570 | 3(6.7) | CTPP FP | CTC-4 | ||
| 5144572-26560 | 2(4.4) | KFCP | SVNCS | ||
| 5144552-26570 | 2(4.4) | TP | ER-3 | ||
| 5044552-34560 | 2(4.4) | AHP | LM | ||
| 5044572-34570 | 2(4.4) | HP CP | |||
| 5144562-36560 | 1(2.2) | MRM | |||
| 5144552-26560 | 1(2.2) | TPS | |||
| 5144472-36560 | 1(2.2) | WPP | |||
| 5044552-34570 | 1(2.2) | JP | |||
| 5044552-24560 | 1(2.2) | LC | |||
| 5044542-34760 | 1(2.2) | CTC-5 | |||
| 4144572-26560 | 1(2.2) | SHP-2 | |||
| 1044552-30560 | 1(2.2) | BYC | |||
| 0044552-30570 | 1(2.2) | MRI | |||
| 5144552-36560 | E. coli ATCC 25922 | ||||
a Per barcode, the first set of numbers (7 digits) represented the ID code generated for an isolate by the API 20E system, and the second set of numbers (5 digits) represented the ID code generated for the same isolate by the Enterotube II system. These were combined to form a 12-digit barcode. All codes identified isolates as E. coli.
b Use isolate abbreviation and Table 1 to determine the source of the isolate (i.e., name and location of the surface water sampled).
Response of E. coli Isolates to Tendifferent Antimicrobials Agents
| Number of Isolates (% of 45 Total)a | |||
|---|---|---|---|
| Antimicrobial Agent (Disk Potency) | Resistant | Intermediate | Susceptible |
| Amoxicillin (30µg) | 0 (0.0) | 4 (8.9) | 41 (91.1) |
| Ampicillin (10 µg) | 7 (15.6) | 12 (26.7) | 26 (57.8) |
| Cephalothin (30 µg) | 16 (35.6) | 20 (44.4) | 9 (20.0) |
| Ciprofloxacin (5 µg) | 0 (0.0) | 0 (0.0) | 45 (100) |
| Gentamicin (10 µg) | 0 (0.0) | 0 (0.0) | 45 (100) |
| Imipenem (10 µg) | 0 (0.0) | 0 (0.0) | 45 (100) |
| Nalidixic acid (30 µg) | 0 (0.0) | 0 (0.0) | 45 (100) |
| Polymyxin B (300 U) | 0 (0.0) | 0 (0.0) | 45 (100) |
| Tetracycline (30 µg) | 2 (4.4) | 0 (0.0) | 43 (95.6) |
| Triple sulfa (0.25 mg) | 9 (20.0) | 4 (8.9) | 32 (71.1) |
a Abbreviations: R = Resistant and S = Susceptible.
E. coli Isolates Resistant to One or More Antimicrobial Agents
| Resistance Levela | Number of Resistant Isolates (% of 45 total) | Response to
Antimicrobial Agentb (Disk Potency) |
Barcode and ID and Source of Resistant Isolatec | ||||||||||||||
|---|---|---|---|---|---|---|---|---|---|---|---|---|---|---|---|---|---|
| Ampicillin (10 µg) | Cephalothin (30 µg) | Tetracycline (30 µg) |
Triple sulfa (0.25mg) | 5144572-36560 | 5144472-36560 | 5144572-26560 | 5144552-36560 | 4144572-36570 | 5144552-26570 | 5044552-34560 | 5144572-26570 | 4144572-26560 | 5044552-24560 | 5144572-36570 | 5144552-26560 | ||
| 1 | 8 (17.8) | I | R | S | I | Lake: DL, IGL |
|||||||||||
| I | R | S | S | Pond: SHP-1 |
Pond: WPP |
||||||||||||
| I | R | S | S | Pond: KFCP |
Stream/creek: FAS |
||||||||||||
| S | I | R | S | Pond: UHP | Lake: LH | ||||||||||||
| 2 | 7 (15.6) | I | R | S | R | Lake: RPL |
River: ER-3 | Pond: AHP |
|||||||||
| R | R | S | S | Pond: FP | Pond: SHP-2 | ||||||||||||
| R | I | S | R | River: DPR | |||||||||||||
| S | R | S | R | Lake: LC | |||||||||||||
| 3 | 4 (8.9) | R | R | S | R | Lake: FLN | Pond: TP | Pond: WP | Stream/ creek: TPS | ||||||||
|
Total number of
resistant isolates per barcode (phenotype): Total number of isolates per barcode (phenotype): |
6 11 |
1 1 |
1 2 |
2 7 |
1 4 |
2 2 |
1 2 |
1 3 |
1 1 |
1 1 |
1 3 |
1 1 |
|||||
a Indicates the number (1, 2, or 3) of antimicrobial agents a particular isolate was resistant to as measured by the Kirby-Bauer method.
b Abbreviations: R = Resistant; I = Intermediate; and S = Susceptible.
c Use isolate abbreviation and Table 1 to determine the source of the isolate (i.e., name and location of the surface water sampled).
Isolation and Identification of E. coli
Positive water samples were either transferred (0.1 ml) from Colisure® bottles to EC broth (Oxoid Ltd., Hampshire, UK) tubes with Durham tubes and incubated at 44.5°C or streaked directly onto Levine’s Eosin Methylene Blue (EMB) agar (Becton, Dickinson, and Company, Sparks, MD). Following incubation, EC broth cultures that displayed gas production in Durham tubes were streaked onto EMB agar. Dark colonies, usually black with a green metallic sheen, were restreaked onto EMB agar and Gram stained to check for purity. Once isolated, organisms were then streaked onto Brain Heart Infusion (BHI) agar (Becton, Dickinson, and Company). Isolates on BHI agar that were Gram-negative single rods, positive for the catalase (based on the slide catalase test with 3% H2O2) and negative for cytochrome c oxidase (based on the oxidase test with 1% N,N-dimethyl-p-phenylenediamine) were tested with the API 20E (bioMérieux, Inc., Durham, NC) and Enterotube II (Becton, Dickinson, and Company) identification systems. ID codes generated from API 20E and Enterotube II tests were used with the apiwebtm and Interpretation Guide (codebook), respectively, to identify isolates. E. coli ATCC 25922 was used as a control for all phenotypic and genotypic tests performed in this study. All isolates identified as E. coli (as well as E. coli ATCC 25922) were maintained on BHI agar slants for additional testing.
Antibiotic Susceptibility Testing
E. coli isolates were transferred with sterile swabs to tubes of sterile saline to achieve turbidity equal to that of a 0.5 McFarland standard. Cell suspensions and sterile swabs were used to inoculate the surface of Mueller-Hinton agar (Becton, Dickinson, and Company) plates. Antibiotic resistance was determined by the Kirby-Bauer method using disks impregnated with the following antibiotics (Becton-Dickinson, Franklin Lakes, NJ): amoxicillin (30µg), ampicillin (10 µg), cephalothin (30 µg), ciprofloxacin (5 µg), gentamicin (10 µg), imipenem (10 µg), nalidixic Acid (30 µg), polymyxin B (300 U), tetracycline (30 µg), and triple sulfa (0.25 mg). Inoculated plates were incubated for 24 h at 37°C, after which the diameters of inhibition zones were measured in millimeters following the manufacturer's instructions to assess resistance, intermediate, or susceptibility.
Multiplex PCR Testing
Multiplex PCR was used for the detection of housekeeping and virulence genes in E. coli isolates [14, 15]. DNA was isolated from cells by taking growth from BHI agar slant or plate cultures, transferring it to 200 μl of sterile water in a microfuge tube, and heating the sample to 99°C in an Eppendorf Thermo Mixer for 15 min to lyse cells. Cooled samples were spun in microcentrifuge for 3 min at 14,000 rpm to pellet cell debris, and 150 μl of supernatant fluid was transferred to a new sterile microfuge tube and stored at 4°C until analyzed by PCR. DNA extracts (2 µl) were amplified in mixtures containing: 0.24 nM of each primer (see Table 2 for primers and expected amplicon sizes [14, 15]), 2.5 U PuReTaq DNA polymerase, 10 mM Tris-HCl, (pH 9.0), 50 mM KCl, 1.5 mM MgCl2, 200 µM of dATP, dCTP, dGTP, dTTP, and BSA (illustraPuReTaq Ready-To-Go PCR Beads, GE-Healthcare, Piscataway, NJ). Final PCR tube additions included 6 µl of primer solution (1 pmol/primer/µl), 2 µl DNA template, and 17 µl of sterile water for reaction volume of 25 µl. Mixes were initially heated to 96°C for 5 min and then subjected to 35 PCR cycles [14]. Each cycle consisted of 1 min of denaturation at 96°C; 2 min of annealing at 65°C for the first 10 cycles, decreasing to 60°C for the remaining 25 cycles; and 1.5 min of elongation at 72°C, increasing to 2.5 min in the remaining 10 cycles (cycles 25 – 35). DNA was analyzed on a 2% agarose gel containing GelRed (Biotium, Inc., Hayward, CA) in a 1X Tris boric acid EDTA buffer. A 100-bp ladder (New England Biolabs, Ipswich, MA) was used as a molecular weight size marker. Products were viewed with UV illumination, and pictures were taken using Gel Doc XR+ system; images were analyzed by Image Lab 3.0 software (BioRad Laboratories, Inc., Hercules, CA).
RESULTS
Isolation and Identification
From a variety of untreated surface waters collected in Illinois and Missouri (Table 1), 37 different locations werefound to be positive for fecal coliforms based on the Colisure® test. From water samples collected at these locations, E. coli was isolated and identified. All isolates (a total of 45) were catalase positive, oxidase negative, and Gram-negative rods occurring singly and were confirmed as E. coli by both API 20E and Enterotube II identification systems (Table 3). In addition, all isolates (i) grew and fermented sorbitol on sorbitol MacConkey agar, (ii) failed to test positive as E. coli serogroup O157:H7 by the RemelRIM™ E. coli 0157:H7 latex test (Thermo Fisher Scientific, Lenexa, KS), and produced weak or no hemolysis on blood agar (data not shown). Only 22 and 44% of the isolates yielded an ID code identical to that of E. coli ATCC 25922, a common control (reference) strain, when using the API 20E and Enterotube II systems, respectively (Table 3). In this regard, all test results obtained in this study for E. coli ATCC 25922 were typical for E. coli, based on information provided by the API 20E and Enterotube II identification systems (Table 3). No atypical test results occurred for the control strain with either system. However, variations in phenotype between isolates and between isolates and the control strain were observed as demonstrated by the differences in the biochemical tests ONPG, LDC, ODC, MAN, RHA, and SAC for the API 20E system and LDC, ODC, gas production, ADO, and DUC for the Enterotube II system (Table 3). Nonetheless, the 10 different ID codes generated from the results of each test system positively identified all isolates as E. coli.
Metabolic Diversity
As a marker for phenotypic diversity, a 12-digit barcode was created for each isolate by combining their individual ID codes from both the API 20E (7-digit code) and Enterotube II (5-digit code) test systems. A total of 18 different barcodes (phenotypes) were recovered from the 37 surface water sites sampled (Table 4). The barcodes most commonly recovered were 5144572-36560 and 5144552-36560. These two phenotypes accounted for 18 (40%) of the 45 isolates and were isolated at least once from each of the different categories (pond, stream/creek, lake, and river) of surface waters that were surveyed. Based on the results of the API 20E system, these two phenotypes differed by a single biochemical test, saccharose fermentation. The phenotype 5144572-36560 (11 isolates) fermented saccharose while the other phenotype 5144552-36560 (7 isolates) was negative for saccharose fermentation (Tables 3 and 4). Nine barcodes were “unique” in that each of these phenotypes was represented by only a single isolate while the other 7 barcodes were identified in 2 to 4 isolates each (Table 4). Overall, there appeared to be no obvious trends in the category of surface water that yielded these “unique” phenotypes of E. coli.
Antibiotic Resistance Profiles
To further evaluate phenotypic diversity, the Kirby-Bauer method was used to assess the in vitro susceptibilities of isolates to 10 different antimicrobial agents. All 45 isolates were either susceptible or intermediate in their responsesto amoxicillin, ciprofloxacin, gentamicin, imipenem, nalidixic acid, and polymyxin B (Table 5). In contrast, resistance to ampicillin, cephalothin, tetracycline, and triple sulfa was observed with 7, 16, 2, and 9 of the isolates, respectively (Table 5). Furthermore, a total of 19 of the 45 isolates (42.2%) were resistant to at least one of the antimicrobial agents, including 11 isolates (24.9%) which were resistant to 2 or 3 of the antimicrobial agents tested (Table 6). Multi-resistant isolates were limited to ampicillin, cephalothin, and triple sulfa resistance. There were no apparent linkages between ampicillin, cephalothin, and triple sulfa resistance, and the only potential pattern was that ampicillin, cephalothin, or triple sulfa resistance did not occur in combination with tetracycline resistance. Resistant isolates represented 12 (66.7%) of the 18 different barcodes (phenotypes) with half of the 38 isolates in these 12 phenotypes exhibiting resistance (Table 6). It should be noted that the barcode most associated with resistance was 5144572-36560 and that this phenotype (positive for saccharose fermentation) was also the most frequently isolated (Table 4). Of the 11 isolates with the 5144572-36560 barcode, 6 (54.5%) showed some level of resistance, including one isolate that was resistant to three antimicrobial agents (Table 6). In contrast, six barcodes (5044572-34570, 5144562-36560, 5044552-34570, 5044-542-34760, 1044552-30560, and 0044552-3057050), mostly “unique” phenotypes consisting of a combined total of 7 isolates, did not display resistance to any of the antimicrobial agents tested. Overall, the majority of resistant isolates were recovered from ponds or lakes, the most common types of surface water surveyed in this study (Table 6).
Multiplex PCR Analysis
Multiplex PCR detected, based on the presence of a 384-bp amplicon, the virulence gene eaeA (intimin) in CTC-1 (5144572-36560) and CTPP (5144572-26570) isolated from Charleston Town Creek and Cougar Trail Prairie Pond, respectively (Fig. 1, Lanes 5 and 6; Tables 1 and 4). The other three virulence genes (stx1, stx2, and hlyA) were not detected in CTC-1 and CTPP. In addition, none of these four virulence genes were detected in the remaining 43 isolates which are represented by FLN (5144572-36560), TP (5144552-26570), LWR (5144572-36560), and SRC (5144572-36560) (Fig. 1, Lanes 7-10, respectively). Forty-four of the isolates, as well as E. coli O157:H7 and ATCC 25922 were positive for the housekeeping gene uidA (β-D-glucuronidase) based on the presence of a 147-kp amplicon (Fig. 1). Only with isolate LC was the uidA gene not detected (Fig. 1, Lane 4; Tables 1 and 4). This organism, isolated from Lake Charleston, was the sole isolate for the barcode 5044552-24560, a “unique” phenotype which was negative for ornithine decarboxylase (ODC) and gas production (GAS) and resistant to 2 antimicrobial agents (Table 3).
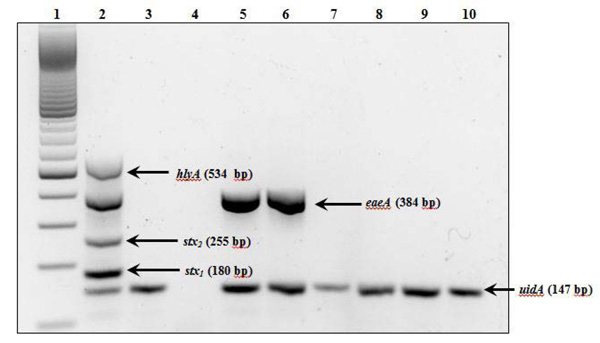
Detection of virulence and housekeeping genes in E. coli isolates by multiplex PCR. Lanes: 1, 100-base pair DNA ladder; 2, positive control (E. coli O157:H7); 3, negative control (E. coli ATCC 25922; 5144552-36560); 4, LC (5044552-24560); 5, CTC-1 (5144572- 36560); 6, CTPP (5144572-26570); 7, FLN (5144572-36560); 8, TP (5144552-26570); 9, LWR (5144572-36560); and 10, SRC (5144572- 36560). Use isolate abbreviation and Table 1 to determine the source of the isolate (i.e., name and location of the surface water sampled). The 12-digit barcode (Table 4) for each isolate is shown in parentheses. Virulence genes were stx1 and stx2 (shiga toxin), eaeA (intimin), and hlyA (enterohemolysin), and the housekeeping gene was uidA (β-D-glucuronidase) (Table 2).
DISCUSSION
In this study,a survey of unrelated urban and rural surface waters (e.g. ponds, streams/creeks, lakes, and rivers) revealed the widespread distribution of E. coli across diverse sources. Historically, these results would suggest point and/or non-point sources of fecal contamination [16-20]. However, recent studies have shown that some E. coli strains may persist and replicate in natural environments such as soils, sediments, and surface waters [11, 12, 21-28]. Therefore, the presence of E. coli alonemay no longer represent recent fecal contamination and instead, may indicate the persistence of some strains in the environment. Future studies using longitudinal monitoring [29, 30] and microbial source tracking [31-33] might help shed more light on the persistence and origin, respectively, of E. coli at the sites surveyed in our study. Nevertheless, E. coli in surface waters is a public health concern, and our data showed that the isolates from different surface water sources possess different phenotypic and genotypic traits (Tables 3, 4, and 6; Fig. 1). Consequently, with their diverse E. coli populations, these surface waters have the potential to serve as reservoirs for the dissemination of currently existing strains as well as the emergence of new variants. In this regard, some of the phenotypic and genotypic attributes related to public health concerns include (i) metabolic richness, which may promote survival of different strains in the environment; (ii) possession of antibiotic resistance; and (iii) harboring of virulence factors.
Barcodes (also referred to as fingerprints or profiles), normally assigned to microorganisms based on phenotypic or molecular analyses, have been used over the years to identify, compare, and track microorganisms [34-39]. In the present study, the diversity of metabolic capabilities among isolates was revealed using the combined API 20E and Enterotube II identification systems, where 18 unique barcodes (i.e., metabolic fingerprints) were identified from the 45 isolates tested (Table 3). No apparent correlation was detected between isolate barcodes and the types of surface water sampled (Table 4). Furthermore, 6 isolates yielded a negative ONPG test result in the API 20E system, suggesting the absence of β-galactosidase activity; yet, these same 6 isolates were positive for lactose utilization in both the Enterotube II and EC broth assays. This discrepancy may be due to the slow conversion of the ONPG substrate under API 20E conditions or to the fact that some strains of E. coli are ONPG negative [40, 41].
The observed heterogeneity in metabolic potentials (barcodes) among our isolates may reveal stochastic events unrelated to selective pressures or it may be seen as evidence for differences in microhabitats among water sources serving as divergent selective pressures. Regardless, this diversity may broaden the ecological adaptability of the species. For instance, 28 isolates represented by 5 barcodes had the ability to utilize sucrose, which is not a trait identified in some reference strains such as E. coli B, C, and K-12 [42] and E. coli ATCC 25922 (this study; Table 3). This ability can provide an obvious survival advantage in environments where sucrose becomes available. Further, in light of the new studies suggesting that E. coli strains persistin the environment [11, 21-28], metabolic heterogeneity can become fodder for natural selection. Indeed, recent studies have shown that E. coli populations in surface waters are genetically diverse and often different than those in sediments or soils [12, 22, 23, 28].
Of the 45 isolates identified in this study, 42% (19 isolates) showed resistance to at least 1 of the 9antimicrobial drugs. In comparison, a survey of both sediment and surface water in California and a survey of a karstic system in France showed that 24% (out of 600) and 20%(out of 392) E. coli isolates carried at least 1 resistance, respectively [12, 13]. In our survey, 4 different drugs were ineffective against at least 1 isolate: cephalothin, triple sulfa, ampicillin, and tetracycline. The 4 most common ineffective antimicrobial drugs in the California and France surveys were rifampicin, erythromycin, tetracycline, and ampicillin and tetracycline, chloramphenicol, amoxicillin, and ticarcillin, respectively [12, 13]. Moreover, amoxicillin, cephalothin, ticarcillin, and sulfa drugs were also found to be ineffective against manynon-E.colienteric isolates [43], suggesting that the resistance to these drugs is widespread among members of the Enterobacteriaceae.
While our survey identified 4 isolates with resistance to 3 different antimicrobial drugs (ampicillin, cephalothin, and triple sulfa), isolates that are resistant to up to 9 different drugs have been discovered [13]. The 4 isolates in our survey were found in 4 different barcode groups and originated from 4 different geographical areas. Notably, two of the barcodes that contained isolates with resistance to 3 antimicrobial drugs also contained isolates with resistance to fewer than 3 antimicrobial drugs. At the same time, 19 of the 37 sites sampled yielded at least 1 isolate with antibiotic resistance. Taken together, our data suggested that there was no direct correlation between the antibiotic resistance of isolates and either their geographic origin or metabolic capabilities. Nonetheless, the presence of resistant organisms in natural surface waters is a concern for both public health issues and for their potential impact on natural microbiota due to their role as natural reservoirs of resistance phenotypes, especially when the tendency of these organisms to replicate and persist in the environment is also taken into consideration [44]. With resistant E. coli types present in the environment, the chance of lateral gene transfer events, like the acquisition of a broad-spectrum β-lactamase determinant bla(CTX-M-15) by a pathogen, is higher [45]. Of the three mechanisms known to contribute to horizontal gene transfer (conjugation, transformation, and transduction), the conjugal transfer of plasmids between microorganisms plays a pivotal role in the evolution of antibiotic resistance and virulence among bacteria including the emergence of novel variants of E. coli [45-48]. Whether plasmids (conjugal or otherwise) contributed to the antibiotic resistance among ourE. coliisolates is unknown. Studies in the future which target the plasmid profiles of our isolates would help provide some insight into the nature of the observed resistance.
In this regard, recent comparative genomic analyses have shown that several virulence factors in pathogenic E. coli strains originated from lateral gene transfer events [49, 50]. Multiplex PCR targeting 3 known virulence genes showed that none of the isolates in our survey contained the stx1/stx2 or hlyA genes, while 2 isolates with different barcodes for metabolic capacities possessed the eaeA gene (Fig. 1). These findings appear to rule out the possibility that any of our isolates were enterohemorrhagic (EHEC) or uropathogenic (UPEC) strains of E. coli, but the detection of eaeA indicated that the enteropathogenic E. coli (EPEC) pathotype may be present [51-53]. In comparison, one study reported that the intimin gene (eaeA) was present in almost 90% of all E. coli isolates identified in different estuaries, while the stx1and stx2 genes were found in about 25% of isolates [54]. Interestingly, in that study, all the isolates carrying the shiga toxin genes also carried the intimin gene.
The uidA gene has been used in PCR assays for E. coli as a control amplicon due to the shared ability to cleave the Colisure® indicator 4-methylumbelliferyl-β-D-glucuronide (MUG) among different strains [15]. In some cases, uidA has even been detected in E. coli strains that tested negative for MUG utilization [15]. Of the 45 isolates, 44 produced a uidA amplicon (Fig. 1) of the correct size and were MUG positive in Colisure® tests (samples fluoresced under long-wave UV light). However, one isolate (LC; Fig. 1, lane 4) did not produce a uidA amplicon despite being MUG positive. This aberrant result may be due to sampling methods where only one colony per water sample was assayed with PCR while there may have been multiple strains present in the sample. Furthermore, despite positive and negative PCR controls, failed PCR amplifications as a result of unidentified inhibitory residues in the DNA extract or sufficient sequence divergence at the primer-annealing sites cannot be ruled out. Lastly, the possibility also exists that this is a new variant capable of cleaving MUG with a novel mechanism.
In summary, our results demonstrated the widespread dispersion of E. coli strains of diverse characteristics (metabolic capabilities, antimicrobial resistance, and presence of pathogenic loci). This heterogeneity in natural E. coli populations has direct implications for interpreting the impact of fecal coliforms on our natural waters and public health. Further studies that can provide more detailed analyses of host origins, geographical sources, persistence behaviors, and dispersal patterns of E. coli strains will be required. Examinations on the fitness and survival qualities of these variants will also be beneficial.
CONFLICTS OF INTEREST
The authors confirm that this article content has no conflicts of interest.
ACKNOWLEDGEMENTS
Financial support from the Department of Biological Sciences and from a Biological Sciences Undergraduate Research Grant (K.J.J.) is greatly appreciated.