All published articles of this journal are available on ScienceDirect.

A Comparative Study of the Outer Membrane Proteome from an Atypical and a Typical Enteropathogenic Escherichia coli
Authors Info & Affiliations
Abstract
This study compared the proteomic profile of outer membrane proteins (OMPs) from one strain of atypical enteropathogenic Escherichia coli (aEPEC) and one of typical EPEC (tEPEC). The OMPs fractions were obtained using sarcosine extraction, and analyzed by one- and two-dimensional gel electrophoresis (1DE and 2DE, respectively). The 1DE OMPs analysis of typical and atypical EPEC evidenced similar patterns; however, the 2DE OMP profile from the aEPEC revealed more protein spots in the 40- to 70-kDa region. 2DE image analysis identified 159 protein spots in both strains whereas 53 protein spots were observed only in tEPEC and 128 were observed only in aEPEC. Remarkably, 41.5% of aEPEC spots showed higher levels of expression compared to tEPEC, some of which with two, others four or even five times more. Twenty-four selected spots were identified using MALDI-TOF mass spectrometry and they corresponded to proteins involved in cell structure and metabolism, as well as in gene regulation. Some of these proteins showed similarity with proteins identified in other E. coli pathotypes. Besides, the differential expression of some proteins in aEPEC may suggest that it could be related to their features that ascertain the adaptation to distinct environments and the worldwide spread distribution of these pathogens.
INTRODUCTION
Diarrheagenic Escherichia coli (DEC) infections are one of the major causes of morbi-mortality in developing and even in industrialized countries. Among the DEC pathotypes, the enteropathogenic E. coli (EPEC) is still a significant pathogen involved in infantile diarrhea [1]. The pathogenesis of EPEC infection is the consequence of the attaching and effacing (A/E) lesion on the intestinal mucosa, which is characterized by microvilli destruction, intimate adherence of bacteria to the epithelium, aggregation of polarized actin and other elements of the cytoskeleton at site of bacterial attachment leading to pedestal-like structures [2]. The ability to induce the A/E histopathology is encoded by genes present on a 35-kb pathogenicity island named locus of enterocyte effacement (LEE) [3]. LEE encodes a 94-kDa outer membrane protein (intimin) responsible for the intimate adherence of the bacteria to the enterocyte membrane; its translocated receptor (Tir); components of a type III secretion system; and effector molecules that interfere with the eukaryotic cell processes [4].
Some EPEC strains carry a plasmid named EPEC adherence factor (EAF), which encodes a type IV pilus called bundle-forming pilus (BFP), which interconnect bacteria within three-dimensional microcolonies [5]. EPEC was subgrouped in typical and atypical, based on the presence and absence of EAF, respectively [6]. Currently, aEPEC is defined as E. coli strains which may or not fit in the classical EPEC serogroups, induce the characteristic A/E lesion, do not express BFP and lack Shiga-toxin genes [7-10].
The outer membrane (OM) constitutes the border between the bacteria and the environment, and as one of its major functions, protects Gram-negative bacteria against adversities. This concentric lipid bilayer covering the cell has 50% of its mass composed by proteins, either integral membrane proteins or anchored lipoproteins [11]. More than twenty diverse outer membrane proteins (OMPs) have been identified in E. coli, and several different characteristics have been already described, including adhesion, invasion, bacteriophage receptors, resistance to antibiotics and permeability controls, as well as structural functions [11, 12]. OMPs so far described in EPEC as virulence factors include intimin [13] and Efa1/LifA [14] acting as adhesins.
Proteomic approaches have been described as powerful platform technology for the study of protein expression and identification (reviewed in reference [15]).
Li et al. [16] compared the proteomic profile of extracellular proteins of tEPEC E2348/69 and enterohemorrhagic E. coli (EHEC) EDL933, demonstrating that besides the four common extracellular proteins EspA, EspB, EspD and Tir, 26 other proteins were conserved in both strains. Here it must be emphasized that the most recent proteomic data for EPEC is related to the prototype strain E2348/69 (serotype O127:H6).
Since the recognition of aEPEC as enteropathogens, several geographic epidemiological reports evidenced its clear predominance as agent of diarrhea syndromes [17-22]. The latest studies have been demonstrated the replacement of tEPEC by aEPEC in developed countries and the high prevalence of the latter in developing countries [8, 21, 23].
Thus in this original study we analyzed by two-dimensional gel electrophoresis (2DE) and MALDI-TOF mass spectrometry the OMP extracts of both tEPEC and aEPEC belonging to the O55 serogroup showing that some of the identified proteins have some similarity with proteins identified in other E. coli pathotypes. Besides, the higher expression of some aEPEC proteins may be related to their features that ascertain the adaptation to distinct environments and the worldwide spread distribution of these pathogens.
MATERIAL AND METHODS
Bacterial Strains and Growth Conditions
Two EPEC strains belonging to the same serogroup: tEPEC O55:H6 (strain 23) and aEPEC O55:H7 (strain 07), were selected for this study. These strains belong to the bacterial collection Laboratory of Bacteriology (Butantan Institute, São Paulo, Brazil) and were previously characterized [24]. Cultures were grown during 18 h at 37°C, under shaking (250 rpm), in 100 ml of Luria-Bertani broth (LB) or in Dulbecco’s modified Eagle medium (DMEM) for the outer membrane proteins extraction.
Isolation of Outer Membrane Proteins (OMPs)
OMPs were isolated by the method described by Achtman et al. [25] with minor modifications. After growth, the bacterial cells were recovered by centrifugation at 4,300 x g for 15 min at 4°C, and suspended in 5 ml of 10 mM Tris buffer pH 8.0 supplemented with 1 mM phenylmethylsulfenylfluoride (PMSF) (Sigma-Aldrich Co., St. Louis, MO). Cells were disrupted by sonication at 50 % output, 2 x 80 sec, and the cell debris were removed by centrifugation. The supernatant was centrifuged at 49,500 x g for 60 min at 4°C and the pellet was treated with 1.67% N-lauroylsarcosine (Sigma-Aldrich Co St. Louis, MO) for 20 min at room temperature. The OMPs were recovered by centrifugation at 23,000 x g for 90 min at 4°C. The pellet was resuspended in 50 ml of 10 mM Tris buffer pH 8.0 with 1 mM PMSF and the protein concentration was quantified by the Bradford method [26] and stored at -20°C. The OMP fractions of both bacterial strains were extracted at the same time and under the same conditions.
One-Dimensional Electrophoresis (1DE)
OMPs extracts were separated by 12.5% polyacrylamide gel electrophoresis containing dodecyl sodium sulphate (SDS/PAGE) according to Laemmli [27] on a Bio-Rad Protean 3 mini-system, and visualized by silver staining [28]. For immunoblotting analysis, OMPs extracts resolved by 1DE were transferred to nitrocellulose membrane and treated as described by Towbin et al. [29], using mouse polyclonal anti-OMP sera, and anti-mouse IgG conjugated to horseradish peroxidase, were used as secondary antibodies. The reaction was developed with a mixture of diaminobenzidine and 3% hydrogen peroxide (Sigma).
2-Dimensional Electrophoresis (2DE) and Image Analysis
Prior to the first dimension, precast IPG strips (24 cm, pH 4-7, linear, GE Healthcare) were rehydrated with 450 µL of DeStreak rehydration solution (GE Healthcare) containing 0.8% IPG buffer (GE Healthcare) and 170 µg of proteins, for 16 h at room temperature. First dimension was carried out in an Ettan IPGphor Isoeletric Focusing System (GE Healthcare) at 20°C with current limit 50 µA/strip until focusing reached 70 kVh. After focusing, the proteins were reduced and alkylated by sequential incubation in the following solutions: 0.05 M Tris-HCl, pH 8.4, 2% SDS; 30% glycerol, 6 M urea, 0.006% bromophenol blue (equilibration buffer-EB), 20 mg/mL DTT in EB; and then a solution of 30 mg/mL iodoacetamide in EB. Then, the strips were directly applied to 12% polyacrylamide gels. Molecular-weight markers (were applied at the basic end of the IPG strips. Electrophoresis was carried out for 12 h at 10°C. Following separation in the second dimension, the gels were fixed and then stained with silver. Images were analyzed (ImageMaster 2D Platinum software, version 5.0; GE Healthcare, Uppsala, Sweden) as follows. Observed molecular masses for resolved proteins were calculated by comparing their mobility to those of molecular weight markers, and the pI values were calculated according to linearity of the IPG strips using the software. ImageMaster 2D Platinum detection parameters, such as number of smooth, saliency, and minimum area, were adjusted for every selected region of each gel to detect protein spots automatically. Subsequently, each protein spot received an identification number, which was confirmed visually. Spots found along the edges of the gels and streaked spots were not considered for further analysis. For each protein, the spot volume was calculated, according to the software manual, as above of the mark border situated at 75% of the spot height (measured from the peak of the spot), which permitted the automatic subtraction of the background values. The volume percentage of each spot was determined in relation to the total amount of all marks in the gel. In order to evaluate the reproducibility between the duplicates and independent experiments, the correlation coefficient was calculated according to the volume percent of paired spots [30]. Spots of each gel of aEPEC and tEPEC were matched and the percent volume of spots was compared. The protein spot levels were considered to have higher or lower volume when there was at least a 1.5-fold difference [31-33].
Protein Digestion and Mass Spectrometry Identification
For protein identification, protein bands were excised from the 2DE gels, destained, and in-gel trypsin digested [34]. The tryptic peptide mixture was lyophilized, dissolved in 0.1% trifluoroacetic acid, subjected to ZipTip C18 (Millipore Co., Bedford, MA), and spotted onto the sample plate of an Ettan matrix-assisted laser-desorption ionization time of flight (MALDI-TOF) / Pro mass spectrometer (GE Healthcare, Uppsala, Sweden) mixed to the same volume of a saturated solution of α-cyano-4-hydroxycinnamic acid (Sigma-Aldrich, Saint Louis, MO) in 50% acetonitrile / 0.1% trifluoroacetic acid, and analyzed using P14R [(M+H)+ 1533.8582] and angiotensin II [(M + H)+ 1046.5423] (Sigma-Aldhrich, Saint Louis, MO) as external calibrants. Mass lists were used to screen against database including Mascot (www.matrixscience.com) programs using the National Center for Biotechnology Information nonredundant database (NCBI nr 2005.01.06). The resulting spectra were searched against non-redundant protein database (NCBI) using Mascot with carbamidomethylation as fixed modification, oxidation of methionine as variable modifications, one trypsin missed cleavage and a mass tolerance of 0.5 Da.
RESULTS
Comparison of OMPs Profiles by 1DE and 2DE
The 1DE OMP analysis was carried out in order to establish the possible differences between tEPEC and aEPEC after being cultivated in LB or DMEM. The expression of OMPs was more prominent for both strains when they were cultivated in LB (Fig. 1). However, no significant differences were observed between the two strains. These findings were confirmed by immunoblotting using mouse polyclonal anti-OMP serum, suggesting that, under these conditions, the qualitative 1DE is not appropriated to compare OMP expression in EPEC (Fig. 2).
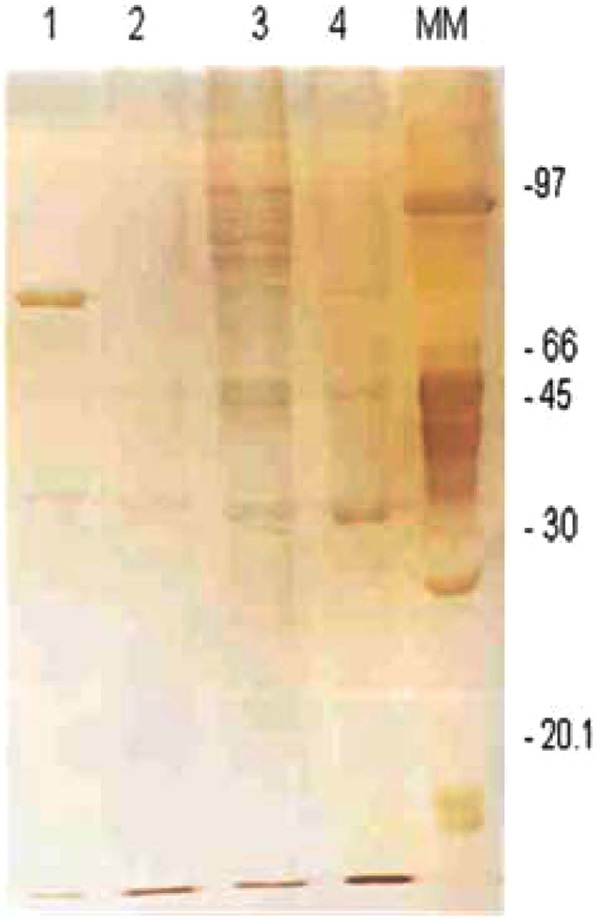
Electrophoretical profile of outer membrane proteins from tEPEC and aEPEC. Line 1: OMP extract from tEPEC grown in DMEM, Line 2: OMP extract from aEPEC grown in D-MEM, Line 3: OMP extract from tEPEC grown in LB. Line 4: OMP extract from aEPEC grown in LB. MM: molecular marker - low molecular weight (AmershanBiotech), in kDa.
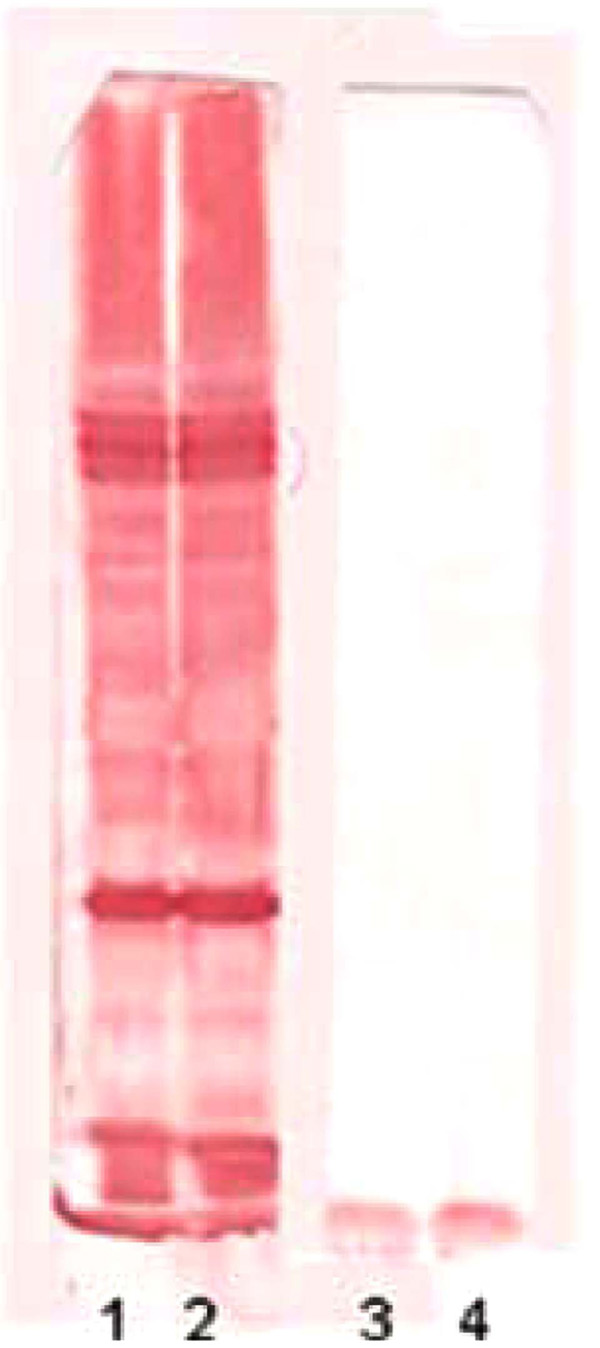
Immunoblotting reaction. Line 1: aEPEC OMP extract reacted with policlonal anti-OMP from aEPEC. Line 2: tEPEC OMP extract reacted with policlonal anti-OMP from tEPEC. Line 3: aEPEC OMP extract reacted with a pool of negative control sera. Line 4: tEPEC OMP extract reacted with a pool of negative control sera.
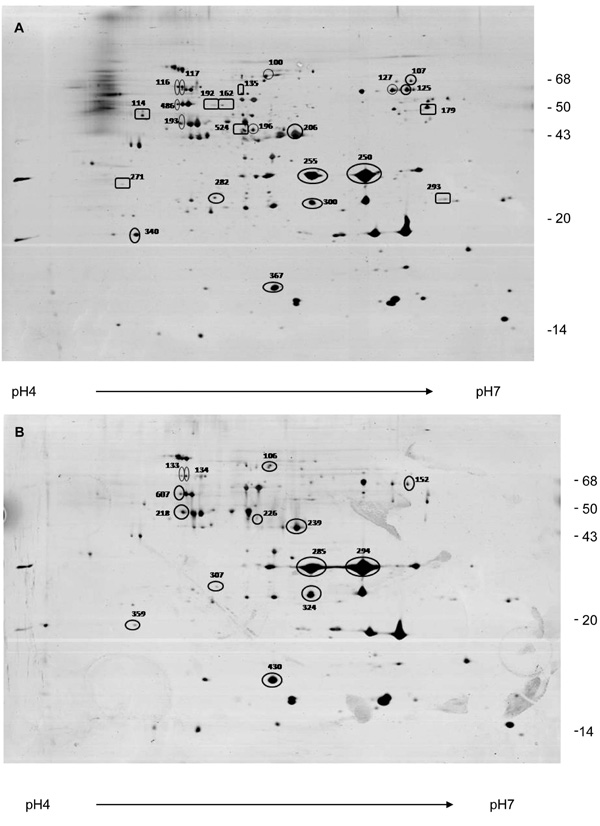
Two-dimensional electrophoresis pattern of OMP extracts from aEPEC (A) and tEPEC strains (B) grown in LB broth. OMP extracts were applied to 4–7 IPG strips for isolectrofocusing followed by electrophoresis on 12% polyacrylamide gel. The gels were silver-stained. Spots indicated with numbers were identified by in-gel trypsin digestion and MALDI-TOF MS. Circle: proteins identified in both strains. Square: proteins identified only in aEPEC.
High-resolution 2DE to separate OMPs was conducted with extracts from aEPEC and tEPEC cultivated in LB, since the expression of OMPs was higher in this medium as indicated by 1DE analysis.
Initially, a broad-range immobilized pH gradient (IPG) strips (pH 3-10) and narrow-range IPG strips (pH 4-7) were tested. Better separation was achieved when pH 4-7 IPG strips were employed (data no shown). Therefore, pH 4-7 IPG strips were chosen for isoelectric focusing in the 2DE experiments. To compare silver-stained protein spots of aEPEC and tEPEC gels, these were concomitantly stained in the same tray, and digitalized as tagged image files (TIF) immediately after staining. 2DE OMP profiles from four pairs of silver-stained analytical gels from four different experiments were compared. Fig. 3 (A and B) shows the electrophoretical profiles of aEPEC (07) and tEPEC (23) OMP extracts, respectively.
The gels were submitted to image analysis using the Image Master Computer program, which detected 159 protein spots in aEPEC and tEPEC gels. Using as analysis parameters the pI value and the molecular mass of each spot present in both gels, the ratios of spot volume between them were estimated. As shown in Table 1, 53 spots of aEPEC showed similar or lower intensity than the correspondent spot of tEPEC, while 40 spots showed a somewhat higher intensity. Interestingly, the remaining 66 spots of the aEPEC strain showed two times and in some cases four or five times higher abundance than the corresponding spots in the tEPEC strain (Fig. 3).
Spot Volume Ratio Between aEPEC and tEPEC
| Ratioa | Number of Spots (%) |
|---|---|
| < 1 | 53 (33.3) |
| Between 1 and 1,99 | 40 (25.2) |
| ≥ 2 | 66 (41.5) |
a -fold change means the ratio of % volume of protein spot of aEPEC and tEPEC.
Proteins Assigned and their Relative Abundances in aEPEC Compared to tEPEC (Fold Change)
| Spot Noa | Protein Assigned | Protein InformationResource Database Codeb | SequenceCoveragec, % | FoldChanged | pI/MWTheoretical | pI/MWExperimental |
|---|---|---|---|---|---|---|
| 07-100 | Hypothetical Protein (E. coli 101-1) | gi|194437497 | 23 | 1.18 | 5.65/21 | 5.38/68 |
| 07-107 | Outer Membrane Usher protein focD precursor | gi|1169721 | 4 | 5.13 | 6.72/96 | 6.18/81 |
| 07-116 | Hypothetical protein (E. coli E22) | gi|193061959 | 9 | 1.86 | 5.04/90 | 4.90/73 |
| 07-117 | Hypothetical Protein APEC01_O1R182 | gi|157412197 | 14 | 4.60 | 6.24/23 | 4.92/72 |
| 07-125 | similar to antirepressor of bacteriophage P22 [Enterobacteria phage VT2-Sakai] | gi|9633431 | 11 | 3.26 | 8.65/28 | 6.16/68 |
| 07-127 | paar (E. coli E22) | gi|193065132 | 12 | 2.25 | 5.0/49 | 6.08/68 |
| 07-193 | Beta-Lactamase SHV | gi|56463239 | 14 | 0.64 | 9.0/27 | 4.91/46 |
| 07-196 | Hypothetical Protein (E. coli E24377A) | gi|157158195 | 16 | 1.49 | 9.1/3.5 | 5.31/45 |
| 07-206 | Elongation factor Tu (E. coli CFT073) | gi|26110363 | 33 | 2.98 | 5.25/45 | 5.55/43 |
| 07-250 | OmpA | gi|157159269 | 22 | 0.81 | 5.65/37.5 | 5.93/28 |
| 07-255 | OmpA | gi|51235578 | 41 | 0.99 | 5.99/37.2 | 5.63/28 |
| 07-282 | Hypothetical protein ECs5262 (E. coli O157:H7) | gi|15834516 | 3 | 3.08 | 5.45/19 | 5.13/23 |
| 07-300 | OmpA | gi|195940407 | 29 | 1.14 | 5.98/29 | 5.64/22 |
| 07-340 | Transposase (E. coli APEC 01) | gi|117624195 | 20 | 15.15 | 9.61/33.6 | 4.67/18 |
| 07-367 | Chain A of OmpX | gi|6435772 | 44 | 1.17 | 5.04/16 | 5.43/14 |
| 07-486 | Protein GspC | gi|191171906 | 10 | 2.35 | 9.78/36 | 4.89/51 |
a Refers to the proteins indicated in Fig. (1A).
b Bacterial proteins.
c The percentage of amino acid coverage (peptides observed/theoretical number from sequence data given in database).
d Fold change means the ratio of % volume of protein spot of aEPEC and tEPEC; the expression is considered enhanced or diminished when the ratio is greater than 1.50- or lower than 0.66-fold. respectively [Wilkins et al., 2002.2003].
Proteins Identified Exclusively in aEPEC
| Spot Noa | Protein Assigned aEPEC | Protein InformationResource Database Codeb | SequenceCoveragec, % | pI/MWTheoretical | pI/MWExperimental | ProteinLocalization |
|---|---|---|---|---|---|---|
| 07-114 | Hypothetical Protein Fpla064 (Plasmid F. E. coli K12) | gi|9507775 | 7 | 5.11/73 | 4.46/75 | und |
| 07-135 | Hypothetical Protein (EAEC 101-1) | gi|194437497 | 23 | 5.65/21 | 5.25/63 | un |
| 07-162 | Putative Trancriptional regulator (E. coli O157:H7) | gi|15829563 | 18 | 6.68/34 | 5.14/51 | Ce |
| 07-179 | sigma-54 dependent transcriptional regulator RtcR (Escherichia coli53638) protein | gi|188494196 | 13 | 6.36/60 | 6.29/49 | C |
| 07-192 | Mobilization Protein | gi|42761412 | 18 | 9.71/38 | 5.05/46 | Un |
| 07-271 | Hypothetical Protein E. coli ECH7EC4076_1310 O157:H7 | gi|189010718 | 92 | 9.69/5 | Un | |
| 07-293 | 5-keto-4-deoxyuronate isomerase (APEC O1:K1:H7) | gi|117625095 | 28 | 5.77/27 | 6.34/29 | Un |
| 07-524 | ORF_f266 (E. coli K12) | gi|537136 | 21 | 7.67/29 | 5.25/44 | C |
a Refers to the proteins indicated in Fig. (1A).
b Bacterial proteins.
c The percentage of amino acid coverage (peptides observed/theoretical number from sequence data given in database).
d unknown cellular location.
e citoplasmic protein.
Moreover, 53 protein spots were observed only in tEPEC (Fig. 3B) and 128 spots only in aEPEC (Fig. 3A). The 2De gels of OMPs from aEPEC showed more protein spots ranging from 40 kDa to 70 kDa, which were not present in tEPEC (Fig. 3B) or expressed in a lower level, suggesting that tEPEC and aEPEC OMP proteomes are significantly different.
Protein Identification
For protein identification, 24 spots were chosen and excised from the gels and submitted to in-gel trypsin digestion for mass spectrometric identification. The chosen spots included some observed only on the aEPEC gel, and some observed in both gels, however with a greater expression level in aEPEC extract (Tables 2 and 3).
Among the identified spots, sixteen were present in both OMP extracts, but the majority showed higher expression levels in aEPEC (Table 2). Eight identified spots were observed only in aEPEC (Table 3). The identified proteins belong to different classes, including proteins involved in cellular metabolism, cellular structure, genome regulation and hypothetical proteins.
Five out of sixteen spots identified in both tEPEC and aEPEC showed similarity to hypothetical proteins, and three of them (spots 07-100, 07-116 and 07-196) showed over expression in aEPEC in comparison to tEPEC, with 1.18 to 1.86 fold changes (Table 2). The other two spots (07-117 and 07-282) were four and three times over expressed in aEPEC, respectively, in comparison to tEPEC (Table 2).
Among the spots identified only in aEPEC, six of them showed similarity to proteins previously reported to be present in other E. coli strains, such as EHEC (spots n. 07-162 and 07-271), enteroaggregative E. coli strain 101-1 (spot n. 07-135), commensal E. coli K12 (spots ns. 07-114 and 07-524), EIEC (spot n. 07-179) and APEC (spot n. 07-293). Four of these proteins were described as hypothetical proteins (spots ns. 07-114, 07-135, 07-271 and 07-524).
All protein sequences of the spots identified only in aEPEC were submitted to PSORT protein localization algorithm [35] and the results are shown in Table 3. The predicted cellular location of five out of eight proteins was determined as unknown, and the other three were cytoplasmic proteins.
DISCUSSION
In this study we analyzed the OMP profile of aEPEC and tEPEC strains belonging to the O55 serogroup using 1DE and 2DE methodologies. No differences were observed comparing the OMP profiles from both strains by 1DE analysis, neither regarding protein band presence nor intensity. This finding indicates that the comparison of OMP profiles between different strains using only 1DE analysis should be considered with precaution.
The choice of O55 serogroup was based on the fact that it is one of the few serogroups shared by aEPEC and tEPEC [1]. Besides, EPEC O55:H6 (tEPEC) used to be the third-most-frequent serogroup implicated in infantile diarrhea [24], while EPEC O55:H7 (aEPEC) is a distinct clone, genetic related to O157:H7 since these two clones seems to have the same most recent ancestor [36], making this aEPEC serogroup a specialized enteric pathogen with a propensity to acquire new virulence genes [24].
Rosensheine et al. [37] reported that some virulence factors related to the LEE region were better expressed when the bacteria were cultivated in DMEM. In our study, the expression of OMPs of EPEC strains was not significant when they were cultivated in DMEM, either in the presence of CO2 or when the bacterial was cultivated in pre-conditioned DMEM (data not shown). This finding must be better elucidated, but it seems s that these proteins present in outer membrane of EPEC strains do not have their expression regulated by the LEE region.
Although the aim of this study was the characterization of OMP profiles, the methodology employed for their extraction [25] resulted in the identification of some cytoplasmatic, periplasmatic and inner membrane proteins involved in biochemical and genomic regulation. It has been well established that some cellular proteins other than OMPs may be present in outer membrane extracts [38]. In order to assure that these results were reproducible, the same amount of protein was loaded on each gel, and the same profile was observed in the different assays. Lai et al. [39] reported the OMPs profile of E. coli minicell, and the more prominent protein spots were identified as OmpA, OmpT and OmpX, ranging from 14 kDa to 40 kDa. The same profile was observed in aEPEC and tEPEC OMPs in our study. OmpA resolved in multiple spots of different masses and isoelectric points, suggesting protein degradation and/or modifications. Similar migration profile of these proteins was previously reported [39, 40].
The analysis of expression ratios between the EPEC strains revealed interesting results. Forty one percent of the spots observed in both OMP extracts showed a higher volume in aEPEC, and the ratio analysis indicated that some of them were three, four or even five times over expressed in aEPEC; however the same volume ratio was observed for the proteins appointed. This higher expression of some aEPEC proteins may suggest that it could be related to their features that ascertain the adaptation to distinct environments and the worldwide spread distribution of these pathogens.
We have validated the expression of 9 proteins assigned as hypothetical proteins of unknown function by genome annotation. The proteome expression of these proteins in EPEC O55 strains validates their existence within the bacteria. These proteins were not related to OMPs by the predicted cellular location analysis, although they may be involved in EPEC pathogenesis or be related to phenotypic features in aEPEC, since they are located in bacterial membrane, and may be the first step in host interaction. These findings are under investigation in our laboratory.
Also noteworthy is the fact that the most of these proteins showed similarity with those identified in other E. coli pathotypes, showing the maintanance of the genetic backbone of the E. coli ancester strains. Spots 07-162 and 07-179 correspond to proteins involved in transcriptional regulation. The first one was reported in EHEC strains, and the second was reported in enteroinvasive E. coli strain 53638 (accession number: NZ_AAKB02000001). The 07-192 spot corresponds to a protein involved in conjugation mobilization, and spot number 07-293 corresponds to an isomerase, reported in an avian pathogenic E. coli [41].
We could not demonstrate the presence and differences in expression rates of intimin of two EPEC strains. This may be explained by the fact that the pI of intimin is 8, i.e., higher than the pI range used in this study. In a strip with a pH range from 3 to 10, the OMP proteins mass do not well resolved. Besides, it is already established that the pH range for OMP best resolutions is 4 to 7 [38].
In the present study we identified in aEPEC by MALDI-TOF-MS methodology proteins involved in the cell structure and biochemistry, as well as in gene regulation and some of these proteins showed similarity with proteins identified in other E. coli pathotypes. Furthermore, these findings represent the first analysis of outer membrane profiles of aEPEC and tEPEC belonging to the O55 serogroup and should contribute to a better understanding of the genetic and biochemical regulation of these strains.
COMPETING INTERESTS
The authors have declared that no competing interests exist.
ACKNOWLEDGEMENTS
Funding
This work was supported by funds of Fundação de Amparo à Pesquisa do Estado de São Paulo - FAPESP (Grants 04/12136-5 to WPE and 06/07145-0 to RMFP). CRT and FFO were recipients of fellowships from Conselho Nacional de Desenvolvimento Científico e Tecnológico. APL is recipient of a fellowship from FAPESP. We thank Dr. Daniel C. Pimenta for the critical review of the manuscript.