All published articles of this journal are available on ScienceDirect.

The ftsZ Gene of Mycobacterium smegmatis is expressed Through Multiple Transcripts
Authors Info & Affiliations
Abstract
The principal essential bacterial cell division gene ftsZ is differentially expressed through multiple transcripts in diverse genera of bacteria in order to meet cell division requirements in compliance with the physiological niche of the organism under different environmental conditions. We initiated transcriptional analyses of ftsZ gene of the fast growing saprophytic mycobacterium, Mycobacterium smegmatis, as the first step towards understanding the requirements for FtsZ for cell division under different growth phases and stress conditions. Primer extension analyses identified four transcripts, T1, T2, T3, and T4. Transcriptional fusion studies using gfp showed that the respective putative promoter regions, P1, P2, P3, and P4, possessed promoter activity. T1, T2, and T3 were found to originate from the intergenic region between ftsZ and the upstream gene, ftsQ. T4 was initiated from the 3’ portion of the open reading frame of ftsQ. RT-PCR analyses indicated co-transcription of ftsQ and ftsZ. The four transcripts were present in the cells at all growth phases and at different levels in the cells exposed to a variety of stress conditions in vitro. T2 and T3 were absent under hypoxia and nutrient-depleted stationary phase conditions, while the levels of T1 and T4 remained unaffected. These studies showed that ftsZ gene expression through multiple transcripts and differential expression of the transcripts at different growth phases and under stress conditions are conserved in M. smegmatis, like in other Actinomycetes.
INTRODUCTION
Eubacterial vegetative cell division by septation is initiated by the cytoskeletal cytokinetic essential protein FtsZ through the formation of polymeric ring structure at the leading edge of the invaginating septum [1, reviewed in 2]. Maintenance of a critical level of FtsZ is obligatory for proper cytokinesis as less or excess of FtsZ results, respectively, in filamentation due to lack of septation or mini cell formation due to septation at the poles of the cells undergoing division [3]. Expression of ftsZ gene has been found to be through co-ordinated differential expression from multiple overlapping transcripts from multiple promoters and/or co-transcription with cell division genes located upstream of ftsZ in diverse bacterial systems, Bacillus subtilis [4], Escherichia coli [5-7], Neisseria gonorrhoeae [8], Corynebacterium glutamicum [9, 10], Shewanella violacea [11], Bartonella bacilliformis and Bartonella henselae [12], and Mycobacterium tuberculosis [13]. Although the function of FtsZ is conserved in bacterial systems, expression of ftsZ gene through multiple transcripts has been found to differ markedly among diverse genera of bacteria, in response to different growth phases and various environmental stress conditions, in E. coli [14], N. gonorrhoeae [15], B. subtilis [16], Streptomyces species [17, 18], C. glutamicum [19], Caulobacter crescentus [20], Anabaena sp. strain PCC 7120 [21], and Prochlorococcus sp. strain PCC 9511 [22].
Mycobacterium smegmatis is a saprophytic fast-growing species of mycobacterium, which was originally isolated from human smegma, the natural lubricant produced underneath the foreskin of penis [23]. Although it is not a human pathogen unlike M. tuberculosis, being a fast-growing saprophytic species, it is an attractive mycobacterial system to study regulation of expression of cell division genes, such as ftsZ, in comparison to those in slow-growing mycobacterial pathogens. In this regard, we had earlier studied ftsZ transcription in the slow-growing pathogen, M. tuberculosis [13, 24]. In the present study, the status of transcription of ftsZ of the fast-growing saprophytic M. smegmatis (MsftsZ) was determined. Multiple transcripts of MsftsZ were identified, putative promoters of which were mapped, confirmed their promoter activity, detected co-transcription of MsftsZ with its immediate upstream gene, and examined the profile of MsftsZ transcripts under different growth phase and stress conditions, which are likely to be experienced by M. smegmatis in its natural environment.
MATERIALS AND METHODS
Bacterial Strains, Media, and Culture
M. smegmatis mc2155 cells [25] were grown in Middlebrook 7H9 (Difco) liquid medium supplemented with 0.2% glycerol, 0.05% Tween 80 and 10% Albumin-Dextrose-Catalase (ADC) enrichment or in Middlebrook 7H10 agar (Difco) medium supplemented with 10% Oleic acid-Albumin-Dextrose-Catalase (OADC) enrichment. The transformants of M. smegmatis cells carrying promoter constructs were grown in the above mentioned liquid or solid media, as the case may be, containing hygromycin at a concentration of 50 μg ml-1. E. coli JM109 cells were grown in Luria-Bertani (LB) medium in liquid or on LB-solid agar, containing 150 μg ml-1 of hygromycin, when required.
Culturing of Cells Under Stress Conditions
An exponentially growing M. smegmatis mc2155 culture at an OD600 nm of 0.5 was subdivided into a series of 20 ml of cultures, the cells were harvested, resuspended in 10 ml of appropriate stress medium and exposed to stress condition for 2 hrs at 37°C in a bacteriological shaker (except heat shock culture, which was kept in non-shaking condition), as described [26]. The stress conditions, 10 mM H2O2 (oxidative stress), pH 5 (acid stress; 1M HCl diluted to get pH 5), 0.05% SDS (detergent stress), and 50°C (heat shock), were employed as described [26]. Other stress conditions employed were 5 M NaCl (hyper-osmotic stress) [27] and 0.2 µg ml-1 of mitomycin C (DNA damage) [28]. Subsequent to exposure to the stress conditions, the cells were harvested and processed, as described [26]. For experiments on cells grown under hypoxia [29], M. smegmatis mc2155 cells were grown in Dubos broth base (Difco), supplemented with ADC, and containing methylene blue, as described [29, 30]. Disappearance of methylene blue colour marked the onset of hypoxic condition, as described [29]. The 12th day hypoxia culture was harvested, washed in Tween-saline buffer (0.05% Tween 80 and 0.8% NaCl). Hypoxia-exposed bacterial cells were found to be synchronised in growth upon release from hypoxic state, indicating successful reproduction of the slow-stirring model of hypoxia [29], as applied for M. smegmatis cells [30]. For generating nutrient-depleted stationary phase cultures, cells were grown to an OD600 nm of 2.5 in a bacteriological shaker and then kept in standing condition for an additional 15 days for the gradual depletion of nutrients, under micro-aerophilic submerged growth.
Growth Synchronisation of M. smegmatis Culture
Synchronous culture of M. smegmatis mc2155 cells was obtained using phenethyl alcohol (PEA), as described [31]. In brief, the cells were grown in Middlebrook 7H9 (Difco) liquid medium, supplemented with 0.2% glycerol, 0.05% Tween 80, and 10% Albumin-Dextrose-Catalase (ADC) enrichment, up to OD600 nm of 0.6. Growth was arrested upon treatment with 0.4% (final concentration) of PEA for 5 hrs. The cells were then washed with 1X PBS (phosphate-buffered saline, pH 7.0), and released from growth arrest by re-suspending in fresh medium and culturing at 37°C. Synchronisation was ascertained by plating this culture at every 30 min for 5 hrs and determining colony forming units (cfu) from the samples at the respective time points.
RNA Isolation, Primer Extension Analysis, and RT-PCR Assays
RNA isolation from mid-log phase (0.6 at OD600 nm) M. smegmatis mc2155 cells was carried out using hot acid-phenol method, as described [24] or using Tri-reagent (Sigma) following manufacturer’s instructions. Primer extension reactions were carried out on 3 µg and 5 µg RNA from each sample, using MsZPE1 and MsZPE2 primers (Table 1), as described [13]. Sequencing ladders were generated on the sense strand PCR products of the ftsZ upstream region, which was amplified from genomic DNA of M. smegmatis using primers, MsQf and MsZPE1 (Table 1). The primer extension gel was exposed to phosphorimager cassette to obtain the profile.
Primers used in the Study
| MsZPE1 | 5' ccaaccaccttgatgaccgcgagg 3' |
| MsZPE2 | 5' caaccataggcttagagttatgtcaagtag 3 |
| MsQf | 5' gcgggatccatgaccgacaccaccgagacgaccgca 3' |
| mgfp1 | 5’ ggcgaattcggtaccatgtcgaagggcgaggagctgttcaccggc 3’ |
| mgfp2 | 5’ gcctctagacttgtacagctcgtccatgccgtgggtga 3’ |
| SigA1 | 5’ gctgctgcaggacctgggccgcgag 3’ |
| SigA2 | 5’ cgccgtagacctggccgatctcgtc 3 |
| MsZ1 | 5' gcgggatccgatatcatgacccccccgcac 3' |
| MsZ2 | 5' gcgtctagagaattcgtgccgcatgaagggcggc 3' |
| MshspXf | 5' gcggatccatgaccaaacttcctgaacgatcacgag 3' |
| MshspXr | 5' ccggaattcgtctagacgggctgacggtctccaccg 3' |
| MsQf-665 | 5’ gcccgcacctgttcgaccgc 3’ |
| P1MsZf | 5' ctagttctgtttgcgcggaactacttgacataactctaagcctat 3' |
| P1MsZr | 5' gatcataggcttagagttatgtcaagtagttccgcgcaaacagaa 3' |
| P2MsZf | 5' ctaggccacgatcagccgcgtccgccccctaccgttctgtttg 3' |
| P2MsZr | 5' gatccaaacagaacggtagggggcggacgcggctgatcgtggc 3' |
| P3MsZf | 5' gctctagagcccctacggcaagggtttg 3' |
| P3MsZr | 5' cgggatccgtggcaggcgcgccg 3' |
| P4MsZr | 5' cgggatcctttgaccgtcggcaggtccgggctc 3' |
Restriction enzyme sites are underlined.
Plasmid Constructs used in the Study
| pMN406 | Plasmid containing mycgfp2+ under the control of Pimyc promoter, Hygr | [32, 33] |
| pMN406-ΔPimyc | pMN406 without promoter Pimyc | [13] |
| pMN406-ΔPimyc-P1 | pMN406 containing 41 bp P1 region, in place of Pimyc at BamHI and XbaI sites | This study |
| pMN406-ΔPimyc-P2 | pMN406 containing 39 bp P2 region, in place of Pimyc at BamHI and XbaI sites | This study |
| pMN406-ΔPimyc-P3 | pMN406 containing 116 bp P3 region, in place of Pimyc at BamHI and XbaI sites | This study |
| pMN406-ΔPimyc-P4 | pMN406 containing 253 bp P4 region, in place of Pimyc at BamHI and SspI sites | This study |
For the estimation of relative activity of the individually cloned promoters, semi-quantitative RT-PCR was performed for mycgfp2+ in M. smegmatis transformants carrying independent promoter-mycgfp2+ constructs and for sigA gene (normalisation control), as described [24]. For RT-PCR, amplifications were carried out at 23 cycles (linear range) for mycgfp2+ and for sigA from transcriptional fusion transformants, using the combinations of primers, mgfp1 and mgfp2 and SigA1 and SigA2 (Table 1), respectively. Total amount of ftsZ mRNA and hspX mRNA were detected by RT-PCR method using specific primer sets (Table 1), MsZ1 and MsZ2 for MsftsZ and MshspXf and MshspXr for MshspX, respectively. The linear range for RT-PCR amplification was 30 cycles at hypoxia and stationary phase for ftsZ and hspX. Total RNA was used to normalise the amplification. Densitometric quantitations of the cDNA bands for the mycgfp2+ and sigA mRNAs were carried out using ImageJ software (NIH, USA), from atleast three independent experiments.
For MsftsQ-MsftsZ co-transcription analysis, five µg of DNA-free total RNA from M. smegmatis cells, which were grown to 0.6 at OD600 nm, and 20 pmoles of MsZPE1 primer were added and the volume was made up to 12.5 µl with DEPC-treated water. Denaturation of RNA was performed at 65°C and snap-cooled on ice for 5 min. Two µl of 10 mM dNTP mix, 4 µl of 5x reaction buffer (Fermentas), and 20 units of Ribolock RNase inhibitor (Fermentas) were added. The primer was annealed at 37°C for 5 min. RevertAid™ Premium Reverse Transcriptase (200 U, Fermentas) was added and extension was allowed for 1 hr at 42°C. Inactivation of Reverse Transcriptase enzyme was carried out at 70°C for 10 min. The cDNA synthesised from MsZPE1 was used for the RT-PCR using MsZPE1 in combination with MsQf and MsQf-665 (Table 1) independently to give products of sizes 1292 bp and 628 bp, respectively. PCR was performed using Taq DNA polymerase in 25 µl reaction volume, where 2 µl of the cDNA reaction mixture was used. Total RNA was used as a negative control for no DNA contamination in RT-PCR reaction.
Construction of MsftsZ Promoter Fusions
The constructs used or generated in this study are listed in Table 2. The vector pMN406 contains mycgfp2+ gene [32], which possesses the same fluorescence enhancing mutations as gfp+ [33] and adapted to the mycobacterial codon usage. The imyc promoter of this vector was deleted to generate pMN406-ΔPimyc [24]. Putative promoters, P1 and P2, were independently cloned at the BamHI-XbaI sites of pMN406, in place of imyc promoter, after annealing two sets of complementary oligonucleotides, P1MsZf and P1MsZr (for P1), and P2MsZf and P2MsZr (for P2), respectively (Table 1). The two respective clones were designated, pMN406-ΔPimyc-P1 and pMN406-ΔPimyc-P2. The putative 116 bp P3 promoter was PCR amplified using primers P3MsZf and P3MsZr, and after sequence verification, cloned at the BamHI-XbaI sites of pMN406, in place of imyc promoter, to generate pMN406-ΔPimyc-P3. For cloning P4, an 879 bp region containing the promoter was PCR amplified using primers, MsQf and P4MsZr (Table 1). The PCR product was cloned in pBS(KS), sequence-verified, digested with BamHI and SmaI, and the resulting 253 bp region was cloned at the BamHI-SspI sites of pMN406, in place of imyc promoter, to generate pMN406-ΔPimyc-P4.
Flow Cytometry Analyses
Qualitative detection of promoter activity in M. smegmatis transformants at exponential phase of growth (0.6 at OD600 nm) was achieved using flow cytometry analyses of MYCGFP2+ protein expressed in the M. smegmatis mc2155 transformants carrying different MsftsZ promoter-mycgfp2+ fusion constructs, as described [24]. In brief, the cells were harvested at different stages of growth and washed once with phosphate-buffered saline (PBS), and resuspended in 1 ml of PBS. Flow cytometry analysis was performed using Becton Dickinson FACScan machine. Dot plots were analysed using WinMDI software, version 2.8.
RESULTS AND DISCUSSION
Identification of Four MsftsZ Primer Extension Products
Primer extension analysis on total RNA from mid-log phase (0.6 at OD600 nm) M. smegmatis mc2155 cells using MsZPE1 primer (Fig. 1A; Table 1), 3’ end of which anneals at 19 nt downstream of ‘A’ of the ATG of ftsZ, identified four primer extension products, probably corresponding to four putative transcripts, which were designated, T1, T2, T3, and T4 (Fig. 1B). The presence of T2, T3, and T4 was further confirmed by extension of another primer MsZPE2 (Fig. 1C; Table 1), 3’ end of which anneals at 92 nt upstream of ‘A’ of ATG of ftsZ, within the ftsQ-ftsZ intergenic region (Fig. 1A). The control experiments using a mixture of E. coli tRNA and single-stranded sense-strand DNA did not show any corresponding bands (Fig. 1B, lane 2), indicating that the primer extension reactions did not involve either non-specific extension or secondary structure-related fall off of the enzyme. T1 starts at A-1060, which is 68 nt upstream of the ‘A’ of the ATG of ftsZ (Fig. 2). The corresponding putative promoter P1 has TAACTC as the –10 sequence, which is located 7 nt upstream of the start site of the transcript, and TTGCGC as the –35 sequence, with a 14 nt gap between the putative -10 and -35 sequences (Fig. 2; Table 3). In M. smegmatis, the consensus sequences for the -10 and -35 regions for the A group promoter are T94A84T63a42a42T78 and T73T58G68a26C57a36, respectively, where the capital letters indicate more than 50% conservation and the lower case letters indicate conservation between 25% and 50%, and the subscript number for each nucleotide indicates percent conservation of the nucleotide [34]. Thus, the -10 and -35 sequences of P1 possess partial consensus to an A group promoter. The 14 bp distance between -10 and -35 sequences seems to be a deviation from the conventional distance of 16-19 bp found in A group promoters in mycobacteria [34]. Nevertheless, there are several examples of mycobacterial promoters, where -10 and -35 sequences are separated by less than 16 bp. Two such examples are the rap promoter of the mycobacterial plasmid, pAL5000 [35], and the gidB promoter of M. smegmatis [36], where in both the cases, the -10 and -35 sequences are separated by a 14 bp stretch.
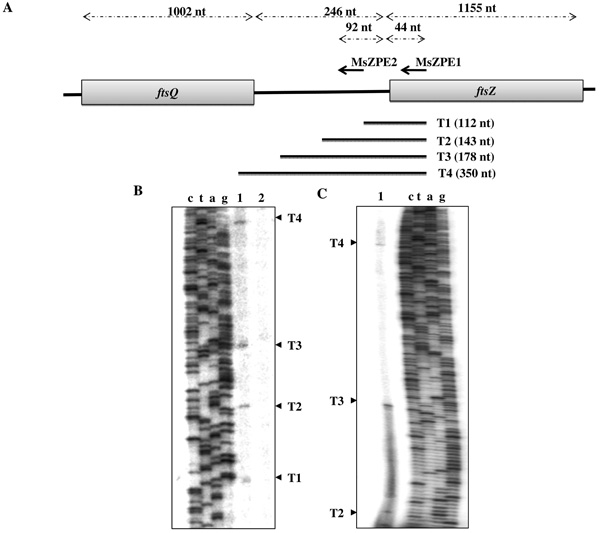
Primer extension analyses for ftsZ gene of M. smegmatis. (A) Schematic representation of the organisation of ftsZ and ftsQ genes of M. smegmaits. MsZPE1 and MsZPE2 primers and positions of their annealing are shown in terms of number of nucleotide (nt). The length of the primer extension products from MsZPE1 primer extension as detected in B and C are shown. (B) and (C) Representative primer extension profiles resolved in Urea-PAGE (6%). Primer extension using MsZPE1 (B) and MsZPE2 (C) primers on RNA: from, M. smegmatis cells (lane 1) and on E. coli tRNA mixed with single-stranded sense strand of the same region of M. smegmatis (negative control) (lane 2).
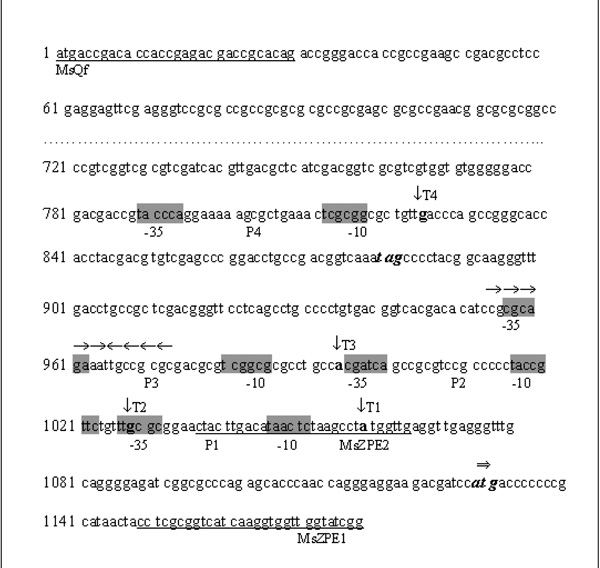
Promoter map and sequences. The exact location and sequence of the four promoter regions in the ftsQ ORF and ftsQ-ftsZ intergenic region are indicated. Underlined sequences indicate positions of primers MsZPE1, MsZPE2 and MsQf. Shaded box indicates -10 and - 35 sequences. Nucleotides in bold font with ↓ on top indicate the +1 site. Convergent arrows indicate inverted repeats detected by EMBOSS (The European Molecular Biology Open Software Suite) PALINDROME program. TAG stop codon of ftsQ shown in bold italics and ATG of ftsZ was shown with bold italics with arrows on top.
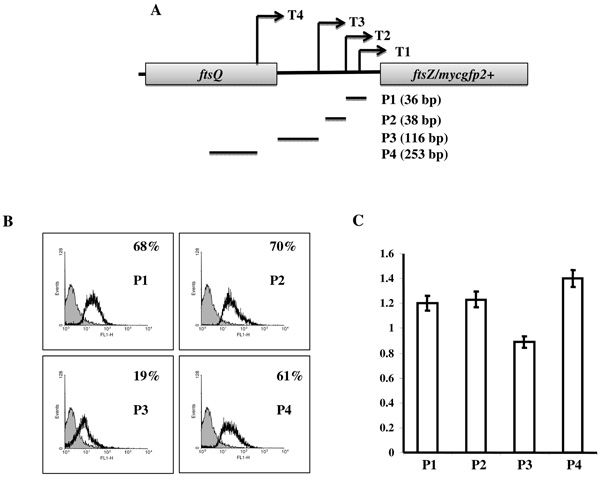
Promoter activity from cloned MsftsZ promoter regions. (A) The topographical placement of transcription start point of T1-T4 (arrows) and positions of the putative mapped promoters cloned upstream to mycgfp2+ gene of pMN406-ΔPimyc promoter probe vector. (B) Representative histograms from flow cytometry analyses of M. smegmatis transformants (carrying independently cloned P1, P2, P3 and P4 promoter regions (indicated in A) in the promoter probe vector pMN406-ΔPimyc) for the MYCGFP2+ activity of the promoters. Blank peaks represent transformants containing mycgfp2+ driving promoter regions (P1, P2, P3 and P4) and grey peaks represent the transformants containing pMN406-ΔPimyc vector without promoter insert (negative control). The value for each histogram represent average % of cells out of three independent experiments that are showing higher fluorescence activity compared to the negative control cells (grey). (C) The graph represents the average relative levels of expression from each cloned promoter region in M. smegmatis cells that were detected using semiquantitative RT-PCR for mycgfp2+. The values of the mycgfp2+ amplifications were normalised with respect to sigA amplification values. The graph represents values of experiments from a minimum of three independent samples at exponential growth (0.5 at OD600 nm). The standard deviations are plotted for each value.
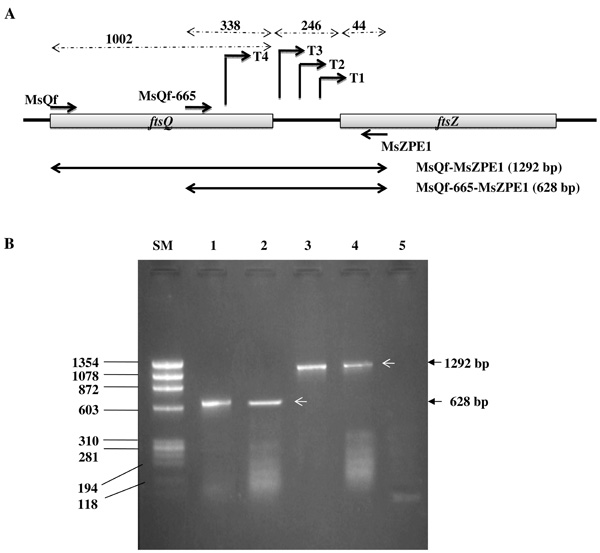
Co-transcription of ftsQ and ftsZ in M. smegmatis (Ms) cells. (A) The schematic diagram indicates the positions of the primers used for cDNA synthesis RT-PCR and the sizes of the PCR products encompassed by the primer pairs. (B) Profile of RT-PCR products. Lanes: SM, Size Marker ФX174 DNA/BsuRI (HaeIII); 1, Ms genomic DNA PCR with MsZPE1 and MsQf-665 (628 bp), showing the expected product; 2, MsZPE1 cDNA used for RT-PCR with MsZPE1 and MsQf-665 primers (628 bp), indicating transcriptional input from ftsQ ORF to ftsZ; 3, Ms genomic DNA PCR with MsZPE1 and MsQf (1292 bp), showing the expected product; 4, MsZPE1 cDNA used for RT PCR with MsZPE1 and MsQf (1292 bp), indicating co-transcription of ftsQ-ftsZ genes; 5, RNA template as negative control.
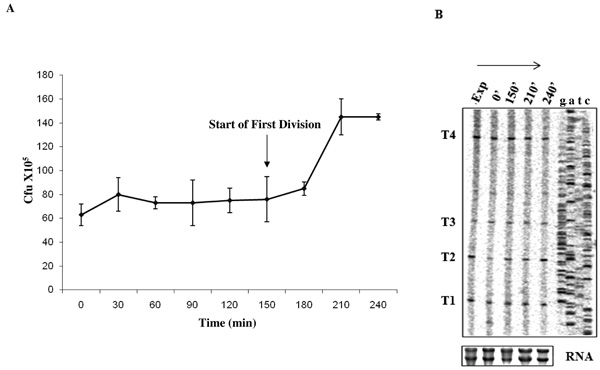
Synchronous growth of M. smegmatis and profile of T1-T4 transcripts. (A) Synchronous growth curve of M. smegmatis culture upon release from PEA treatment. The time points (post-release from PEA), at which the cells were harvested for analysis, are shown on X-axis. The arrow shows start of synchronous division post-release from PEA (at 150 min). (B) Primer extension analysis using primer MsZPE1 from 3 µg RNA (lower panel) from each time point (0 min, 150 min, 210 min, and 240 min) post-release from PEA treatment and consequent growth arrest, compared to the exponential culture (Exp). Profiles of RNA samples used for primer extension are shown in lower panel.
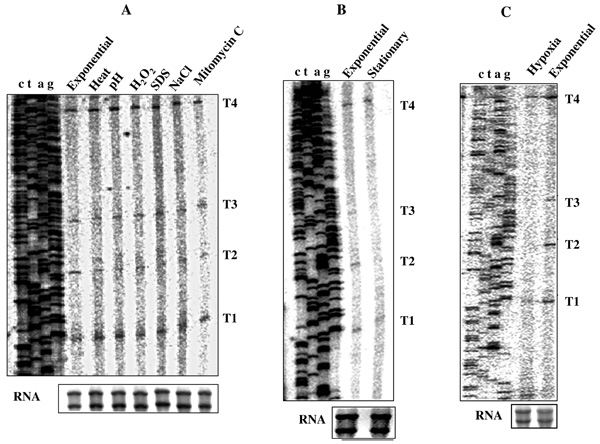
Primer extension (PE) profile of T1, T2, T3, and T4 transcripts from the cells under various in vitro and in vivo stress conditions. (A) Various in vitro stress conditions. (B) nutrient-depleted stationary phase. (C) hypoxia-induced NRP2 stage. Profile of RNA samples used for the analyses is shown in box below the PE gel.
T2 originates at G-1028, which is 99 nt upstream of the ATG of ftsZ and within the -35 box of P1 (Fig. 2). The -10 sequence TACCGT, which is 7 nt upstream of the mapped +1 site, possesses partial consensus to the -10 sequence, T85A85NA57c42T71, of B group promoters in mycobacteria [34]. The putative -35 box, CGATCA, is 17 nt upstream of the -10 sequence, TACCGT, and is not conserved (Table 3), as observed for B group of mycobacterial promoters [34]. This makes P2 to be classified as a B group promoter. It has been demonstrated that the -10 regions of mycobacterial promoters are similar to those of E. coli promoters, in contrast to their -35 regions that can tolerate a greater variety of sequences, presumably owing to the presence of multiple sigma factors with different or overlapping specificities for -35 regions [37]. Interestingly, there is the CTGCCA sequence, which is separated from the -10 sequence by 21 bp and possessing partial consensus to the -35 sequence (T73T58G68a26C57a36) of A group promoter [34]. Further, the -10 sequence, TACCGT, also shows partial consensus to the -10 sequence, T94A84T63a42a42T78, of A group promoter. In view of these possibilities, pending elucidation of activity, P2 may be grouped as an A group promoter as well. Further, at 5 nt upstream of the T2 start site, P2 region contains a sequence possessing consensus to the -10 sequence, CCGTTC, of SigH [G/C GTT C/A/G, 38, 39] or SigE [G/C GTT C/A/G, 39, 40] also, but without a corresponding -35 consensus sequence. However, we have not carried out detailed mutational studies to determine the exact sequence of the promoter.
T3 starts at A-994, which is 134 nt upstream of the start codon, ATG, of ftsZ (Fig. 2). The putative -10 box (8 nt upstream of +1 site), TCGGCG, and the -35 sequence, CGCAGA, are at a distance of 17 nt gap between them. The -10 and -35 sequences do not show consensus to any specific sequence and no other sequences could be detected within the accepted distances of expected -10 and -35 sequences from the transcription start site. Therefore, the putative promoter, which drives the expression of T3, pending elucidation of activity, was designated as P3 with the putative -10 and -35 sequences. According to the A, B, C, and D grouping of promoters, the -10 and -35 sequences of C group promoters do not possess any consensus, but do show promoter activity [34]. Therefore, P3 was classified as a C group promoter. Analysis for the presence of repeat sequences using PALINDROME software identified an imperfect inverted repeat only in the P3 region (Fig. 2, indicated by opposing arrows), indicating that the promoter may be subject to regulation. T4 originates at G-825, which is 56 nt upstream of the ‘G’ of the stop codon, TAG, of ftsQ and 303 nt upstream of the ATG of ftsZ (Fig. 2). The putative -10 sequence, TCGCGG (7 nt upstream of +1), and the -35 sequence, TACCCA, are also spaced by 17 nt gap (Fig. 2; Table 3). The -10 and -35 sequences of T4 also do not possess any consensus sequence. Therefore, the putative P4 promoter, which has been predicted to transcribe T4, was classified as a C group promoter [34], pending elucidation of activity.
T1, T2, T3, and T4 are True Transcripts
In order to verify whether T1, T2, T3, and T4 are true transcripts originating from authentic promoters or whether they are RNA processed products, the regions encompassing –10 and -35 sequences, and +1 start sites, of the putative promoter regions, P1, P2, P3, and P4 (Figs. 2, 3A), were individually cloned in pMN406-ΔPimyc (containing mycgfp2+ reporter gene, but without Pimyc promoter; 13, 24) upstream of mycgfp2+ reporter gene. Flow cytometry analyses for MYCGFP2+ expression in the independent M. smegmatis transformants revealed that P1, P2, P3, and P4 drove expression of mycgfp2+ (Fig. 3B). Noticeably, expression from pMN406-ΔPimyc-P1, pMN406-ΔPimyc-P2 and pMN406-ΔPimyc-P4 were comparably equivalent at 60% – 70% higher level of expression, in comparison to the vector control cells (containing pMN406-ΔPimyc) at the exponential phase of growth. On the contrary, expression from pMN406-ΔPimyc-P3 was significantly low (19%) (Fig. 3B). MYCGFP2+ expression confirmed that P1, P2, P3, and P4 indeed possessed promoter activity. These observations confirmed that the putative transcripts T1, T2, T3, and T4 were authentic transcripts that originated from the authentic promoter regions, P1, P2, P3, and P4, which were predicted based on 5’ end mapping of the transcripts. It may be recalled here that P2 promoter, pending elucidation of activity, could earlier be classified as a B or A group promoter, based on whether the -35 sequence was CGATCA (17 nt away from -10 sequence; B group) or CTGCCA (21 nt away from -10 sequence; A group). However, the oligonucleotide used for cloning the putative P2 promoter (predicted as belonging to B group of promoters) contained the complete -35 sequence of CGATCA of B group promoter, but only the partial 4 nucleotides, GCCA, of the -35 sequence of CTGCCA of the A group promoter. Since the P2 promoter, which was cloned using this oligonucleotide, showed 70% higher levels of activity, compared to the negative control (Fig. 3B), the authentic -35 sequence of P2 promoter might be CGATCA, and not CTGCCA, thereby classifying it as a B group promoter (Table 3).
It may be noted here that GFP being a protein having long half-life, the levels of MYCGFP2+ expression was considered only as a means for the detection of promoter activity and not for the quantitative evaluation of the contribution of activity from the individual promoters. Therefore, in order to measure the relative levels of activity of the individual promoters, the levels of mycgfp2+ mRNA produced by the four individually cloned promoter regions were measured. For this purpose, semi-quantitative RT-PCR was carried out on the total RNA isolated from the M. smegmatis transformants, carrying the promoter-reporter gene constructs, at the exponential phase of growth (0.5 at OD600 nm). The levels of expression of mycgfp2+ mRNA was detected and normalised with respect to the level of expression of sigA as described earlier [13, 24]. The levels of expression from P1, P2 and P4 were found to be comparably equivalent (Fig. 3C). Expression from P3 was found to be lower than that from P1 or P2 (about 1.3-fold lower, P value 0.0058, SD 0.015) and P4 (about 1.6-fold lower, P value 0.0009, SD 0.01) (Fig. 3C). However, it may be noted here that the actual level of activity of a promoter could be very different in the genomic context in vivo than from the cloned minimal region containing +1, -10, and -35 sequences upstream of mycgfp2+.
The ftsZ gene has been found to get expressed through multiple transcripts in many Gram-positive bacterial genera, B. subtilis [4], C. glutamicum [9, 10], Streptomyces species [17, 18, 41], and M. tuberculosis [13], and in Gram-negative bacteria, E. coli [5-7, 42], N. gonorrhoeae [8], S. violacea [11], and B. bacilliformis and B. henselae [12]. The organisation of the region spanning ftsQ open reading frame-intergenic region-ftsZ open reading frame, is conserved in all mycobacterial species and in lower Actinomycetes species. Similarly, the presence of multiple ftsZ promoters and their organisation, which were found conserved in Streptomyces species [17, 18, 41], Corynebacterium [10], and M. tuberculosis [13], was present in M. smegmatis also. Since Streptomyces species, Corynebacterium, and Mycobacteria belong to Actinomycete family, it is possible that the similarity in the organisation of multiple promoters and the pattern of transcription of ftsZ from multiple promoters in these members of Actinomycete family (Streptomyces, Corynebacterium, and Mycobacteria) probably might have originated from a common ancestral pattern.
Co-Transcription of MsftsQ and MsftsZ
Presence of transcript originating in the ftsQ region and apparent absence of any transcription terminator sequence within the ftsQ-ftsZ intergenic region were indicative of the possibility that ftsQ and ftsZ might be getting co-transcribed in M. smegmatis. In order to verify such a possibility, cDNA was generated using MsZPE1 primer on total RNA from M. smegmatis mc2155 cells (Table 1; Fig. 4A). The cDNA was amplified independently using two sets of primer pairs. These were MsQf and MsZPE1 pair and MsQf-665 and MsZPE1 pair (Table 1; Fig. 4A). The MsQf and MsZPE1 pair would yield 1292 bp product (1002 bp + 246 bp + 44 bp), spanning MsftsQ ORF (1002 bp), MsftsQ-MsftsZ intergenic region (246 bp), and 44 bp of the 5’ region of MsftsZ ORF (Fig. 4A). Similarly, the MsQf-665 and MsZPE1 pair would give 628 bp product (338 bp + 246 bp + 44 bp), comprising of 3’ region of MsftsQ (338 bp), MsftsQ-MsftsZ intergenic region (246 bp), and 5’ region of MsftsZ ORF (44 bp) (Fig. 4A). These two primer sets gave the expected size products of 1292 bp and 628 bp, respectively from the cDNA (Fig. 4B, lanes 2 and 4, respectively). The same primer sets were also used for PCR on genomic DNA to yield same products, 1292 bp and 628 bp, as positive controls (Fig. 4B, lanes 1 and 3, respectively). The template-minus negative control sample (RNA alone) did not yield any PCR product (Fig. 4B, lane 5). These observations revealed that MsftsQ and MsftsZ are co-transcribed in M. smegmatis mc2155 cells.
Although the farthest MsftsZ promoter that has been mapped in this study is P4, which is in the reading frame of the upstream gene, MsftsQ, co-transcription of MsftsQ and MsftsZ indicates the possibility that the promoter(s) of MsftsQ are likely to be involved in controlling the expression of MsftsZ as well, through co-transcription with MsftsQ. Such instances of co-transcription of ftsZ with upstream gene and controlled by far upstream promoters have been documented in many bacterial genera. For instance, in E. coli, a large proportion of the ftsZ transcription comes through co-transcription from two promoters, ftsQ2p and ftsQ1p, which are located 5’ to the second upstream gene, ftsQ [5, 6, 7, 14]. Similarly, in N. gonorrhoeae, one promoter that is 5’ to the second upstream gene, ftsQ, drives expression of ftsZ as a co-transcript with ftsQ [8]. Low abundance transcription of C. glutamicumftsZ was observed as a bicistronic mRNA from a promoter 5’ to the upstream ftsQ gene [10]. One of the promoters, from which B. subtilisftsZ is transcribed, is located 5’ to the upstream gene, ftsA [4]. Four transcripts of B. bacilliformisftsZ are synthesised as co-transcripts with upstream genes [12]. Thus, the trend of co-transcription of ftsZ with the upstream gene under the control of upstream promoters is conserved in the transcription of MsftsZ also.
MsftsZ Transcripts Under Different Growth Phases
Various growth phase-specific alterations in the number of ftsZ transcripts have been reported in many bacterial systems. For instance, in E. coli, while all the five ftsZ promoters are active during exponential phase of growth, the ftsQ1p promoter, which is weakly active during exponential phase, gets strongly induced during stationary phase [43]. Similarly, in B. subtilis, while the promoters, P1 and P3, are active during vegetative phase, P2 gets activated only during sporulation [16]. In the lower Actinomycete, C. glutamicum, all the five promoters of ftsZ are active only during exponential phase and are down-regulated during stationary phase [19]. While the ftsZ2p promoter in S. coelicolor is essential for sporulation but not for vegetative growth [18], in S. griseus, the Pveg promoter is active moderately during vegetative growth, but gets switched off within the first 2 hrs of sporulation and, instead, two sporulation-specific transcripts are synthesised up to 5-fold, shortly before the formation of sporulation septa [41]. For these reasons, and M. smegmatis being a member of the Actinomycete family to which Streptomyces and Corynebacterium belong, it was of interest to find out whether all the four transcripts, T1, T2, T3, and T4, and/or whether any new MsftsZ transcripts were synthesised under different growth phases. In order to study the profile of MsftsZ transcripts under different growth phases, phenethyl alcohol (PEA) was used to synchronise M. smegmatis cells in culture, as described [31]. Release from PEA-mediated growth arrest showed synchronous progression of cells through growth and cell division (Fig. 5A), indicating successful synchronisation using PEA. The cells in the synchronised culture were consistently found to start division by 150 min post-release and finish division by 210 min, with the 0 time point being the time point at which the cells were released into fresh medium, post-exposure to PEA.
Primer extension was carried out on 3 µg of total RNA isolated from the cells harvested at 0 min, 150 min, 210 min, and 240 min (a time point that is beyond one division cycle of about 3 hrs for M. smegmatis cells). All the four transcripts, T1, T2, T3, and T4, were present in growth-arrested cells as well as at all the phases of growth and division, post-release from PEA block (Fig. 5B). However, relative densitometric quantitation of the transcript bands, generated from the same amount of RNA (Fig. 5B, lower panel), showed that the ratio of T2 at 0 min post-release to T2 of exponential phase (0.57 ± 0.03) was significantly low (P value, 0.0001-0.0003) in all the repeat experiments (n = 3), as compared to the same at other time points (0.95 ± 0.04 at t = 240, 0.92 ± 0.02 at t = 210 and 0.87 ± 0.02 at t = 150). The ratio of T2 at 0 min post-release to T2 of exponential phase also showed a gradual recovery from t = 0 (0.57 ± 0.03) to t = 150 min (0.87 ± 0.02), prior to division. The ratio of the levels of T2 at t = 210 to that of T2 at exponential phase (0.92 ± 0.02) or at t = 240 to that of T2 at exponential phase (0.95 ± 0.04), after division, becomes comparable to the levels of T2 at exponential phase. Such changes were not found for T1, T3, and T4. These observations indicate that even though all the transcripts are synthesised at various phases of synchronous growth, T2 expression is significantly reduced upon growth arrest, which over a period, gradually becomes normal, prior to division and subsequent growth. However, it is not clear whether this reduction is a manifestation of growth arrest-specific change in the transcription from P2 promoter or a stress response effect on P2 promoter due to growth arrest by PEA.
MsftsZ Transcripts Under Different Stress Conditions
Besides growth phase-specific changes in ftsZ expression, it has been reported that altered expression of ftsZ can influence cytokinesis, resulting in cell division modulation under stress conditions. For instance, among the three N. gonorrhoeaeftsZ transcripts, Pz1, Pz2, and Pz3, Pz1 alone was expressed prominently and strongly under anaerobic condition [8, 15]. Reduction in expression of all the transcripts was observed in the presence of urea, which is one of the stress conditions that exist in the environment of the genitourinary tract [15]. Similarly, in S. coelicolor A3(2), which comes under Actinomycete family to which mycobacteria belong, the transcript from ftsZ2p promoter was predominantly expressed during nutrient stress leading to sporulation (vegetative growth inhibition) and inactivation of the promoter was found to affect sporulation septation [18]. The in vitro and in vivo stress conditions, namely heat shock, acid stress, oxidative stress, detergent, osmotic, DNA damage, hypoxia, and nutrient-depleted stationary phase are experienced by the pathogen, M. tuberculosis, in human host [26-29]. M. smegmatis, although a saprophyte, has also been found to mount response to some of these stress conditions in a manner comparable to that mounted by M. tuberculosis [27, 30]. For these reasons, it was of interest to find out whether all the four transcripts, T1, T2, T3, and T4, and/or whether any new MsftsZ transcript(s) were synthesised under different stress conditions.
For this purpose, total RNA was isolated from M. smegmatis cells exposed individually to heat shock, acid stress, oxidative stress, detergent stress, osmotic stress, and DNA damage stress in vitro, and from cells under hypoxia and nutrient-depleted stationary phase in vivo. Primer extension analyses were carried out with MsZPE1 primer (Fig. 1A; Table 1) on 3 µg of total RNA from each sample. The T1, T2, T3, and T4 transcripts were present, with some changes in their levels, under all the in vitro stress conditions. Besides the identified 4 transcripts, no new transcript(s) could be detected (Fig. 6A). Relative densitometric quantitation from several gels for each band indicated that the levels of T2 and T3 transcripts varied under different stress conditions. While T1 and T4 transcripts remained unaffected, T3 transcript level was found slightly reduced under most of the stress conditions. T2 level was found to be low under all the conditions and could barely be detected under SDS stress. In order to determine the general relative trend in the stress responsiveness of P2 promoter with respect to P1, under heat shock, semi-quantitative RT-PCR was carried out on total RNA for mycgfp2+ mRNA from M. smegmatis transformants, carrying pMN406-ΔPimyc-P2 and pMN406-ΔPimyc-P1 promoter constructs. While the ratio of the levels of mRNA of mycgfp2+ to sigA remained constant for P1 transcriptional fusion at exponential phase and under heat-shock condition, activity of P2 (measured by RT-PCR for mycgfp2+ to sigA mRNA) was found reduced by 1.6-fold. This indicated that in vitro stress conditions such as heat shock do affect differential expression of ftsZ transcripts, as revealed in the primer extension assay.
Similarly, under hypoxia and nutrient-depleted stationary phase conditions, only T1 and T4 transcripts, but not T2 and T3 or any new transcript(s), were present in the cells (Fig. 6B, C). In order to test whether the differential expression of ftsZ by different promoters was really reflected in the differential levels of ftsZ mRNA, the levels of ftsZ mRNA (normalised with respect to total RNA) were determined using semi-quantitative RT-PCR on total RNA from the cells under hypoxia and nutrient-depleted stationary phase of growth. About 50% reduction in the total ftsZ mRNA levels was observed during hypoxia and nutrient-depleted stationary phase of growth, compared to that in exponential culture. The hspX mRNA, which is the molecular marker upregulated under this condition in mycobacteria [44-48], showed 2-fold increase, confirming that the cells were indeed under hypoxia. These observations indicated that there was reduction in the level of ftsZ expression through the modulation of the expression of P2 and P3 promoters in M. smegmatis cells under nutrient-depleted stationary phase and hypoxic conditions of growth.
Thus, taken together, differential expression of ftsZ gene through multiple transcripts and through co-transcription with the immediately upstream gene are conserved in M. smegmatis, as in other diverse bacterial genera, especially in other Actinomycetes to which M. smegmatis belong. In addition to the differential expression of transcripts, it is possible that the transcripts are differentially processed and/or translated, thereby modulating FtsZ protein levels and affecting cytokinesis, as critical levels of FtsZ are essential for septation [3]. Nevertheless, as in other bacterial systems, differential expression of ftsZ gene from multiple promoters might facilitate regulation of cell division at different growth phases and in response to various environmental stress conditions, which M. smegmatis might be exposed to.
ACKNOWLEDGEMENTS
The work was supported by grants from the DBT – Infrastructure Programme Support for Basic Biological Research / Pathogen Biology at Indian Institute of Science and in part from the part-grant from the DBT Centre of Excellence in Tuberculosis. The authors thank Dr. Michael Niederweis for pMN406 vector. Dr. Omana Joy, Flow Cytometry Facility at the Division of Biological Sciences, Indian Institute of Science, is gratefully acknowledged for the technical support in flow cytometry analyses. SR and SV acknowledge senior research fellowships from the Council of Scientific and Industrial Research, Government of India, during the present study.