All published articles of this journal are available on ScienceDirect.

Utilisation of Carbon Sources by Pythium, Phytophthora and Fusarium Species as Determined by Biolog® Microplate Assay
Abstract
This study examined the metabolic activity of pure cultures of five root pathogens commonly found in closed hydroponic cultivation systems (Phytophthora cryptogea (PC), Phytophthora capsici (PCP), Pythium aphanidermatum (PA), Fusariumoxysporum f.sp. radicis-lycopersici (FORL) and Fusarium solani (FS)) using sole carbon source utilisation in order to develop effective biocontrol strategies against these pathogens. Aliquots of 150 µL of the mycelial suspension were inoculated in each well of GN2 microtitre plates. On the basis of average well colour development and number of positive wells, the pathogens were divided into two groups, (i) PA and FORL and (ii) PC, PCP and FS. Group (i) was characterised by a short lag-phase, a rapid exponential phase involving almost all carbon sources offered and a long stationary phase, while group (ii) had a more extended lag-phase and a slower utilisation rate of the carbon sources offered. The three isolates in group (ii) differed significantly during their exponential phase. The lowest utilisation rate of carbon sources and number of sources utilised was found for PCP. Of the major group of carbon sources, six carbohydrates, three carboxylic acids and four amino acids were rapidly used by all isolates tested at an early stage. The carbon sources gentibiose, α-D-glucose, maltose, sucrose, D-trehalose, L-aspartic acid, L-glutamic acid, L-proline persisted to the end of the exponential phase.Moreover, similarities between the metabolic profiles of the tested pathogen and the those of the resident microflora could also be found. These findings are of great importance as regards the role of the resident microflora in the biocontrol.
INTRODUCTION
Closed hydroponic growing systems are considered to be environmentally sound due to the reuse of excess nutrient solution and easy management of water and nutrient supply in these systems, which decreases nutrient leakage into the environment. However, the spread of root-borne pathogens such as species of Phytophthora, Pythium and Fusarium in these systems is a matter of great concern [1]. There are technical and biological methods available to reduce or eliminate the spread of root-borne pathogens with the circulating nutrient solution [2]. However, these do not affect the dispersal of pathogens between plants connected to one another through their root system, i.e. plants within the same slab or on the same irrigation board. Here, addition of biological control agents may be an attractive measure.
In order to prevent dispersal of root pathogens in hydroponic cropping systems, early warning systems and systems for timing of biological control agents are needed. Warning systems operate by predicting an outbreak or disease intensity in cultivation systems, host and/or pathogen conditions. Information on the behaviour and ecology of the pathogens is thus essential for the development of such systems and thereby for effective biocontrol strategies against root diseases.
In this initial study, we examined the ability of pure cultures of three oomycetes and two species of Fusarium, all prominent in hydroponic systems with vegetables and berries, to utilise sole carbon sources. Previous investigations on the functional diversity of the resident microflora in hydroponic systems have indicated differences in the metabolic profiles affected by plant species and cultivar [3] and by seasonal variations during the cultivation period [4]. Moreover, faster utilisation of sole carbon sources by the resident root microflora has also been indicated using Biolog GN2 panels after exposure of tomato roots to the fungal root pathogen Pythium ultimum [5]. The use of sole carbon source utilisation profiles (SCSUP) based on Biolog GN2 panels to assess the metabolic activity of fungal root pathogens as pure cultures is therefore of great importance in discriminating it from the metabolic activity of the resident microflora.
MATERIALS AND METHODS
Fungal Cultures
The pathogens Phytophthora cryptogea (isolate 307.62), Fusarium oxysporum f.sp. radicis-lycopersici (isolate 1011587), Phytophthora capsici (isolate 521.77), Fusarium solani (isolate 115659) and Pythium aphanidermatum (isolate 634.70) were obtained from Centraalbureau voor Schimmelcultures (CBS), Baarn, the Netherlands. All pathogens were maintained in the dark on potato dextrose agar (DIFCO 213400). The plates were incubated at 23oC.
Pure cultures of these pathogens were cultivated on PDA plates for two weeks. For harvesting of the cultures, 10 mL of 0.85% sterile NaCl were added to the plates before abrasion. Ten plates (replicates) were used for each fungal species.
Carbon Source Utilisation
Utilisation of organic compounds was studied on Microlog GN2 panels (Biolog, Haywood, CA, USA). The 96 wells of the microtitre plates contain a low concentration, buffered nutrient medium, a carbon source (except the control well) and the redox dye tetrazolium. According to [6], the carbon compounds in the GN2 panel can be divided into 11 groups: alcohols, amides, amines, amino acids, aromatic compounds, brominated compounds, carbohydrates, carboxylic acids, esters, phosphorylated compounds and polymers. The redox dye tetrazolium is soluble in water in its oxidised state and appears colourless. Through microbial respiration, tetrazolium blue is reduced to the insoluble violet formazan complex, irreversibly deposited inside the bacterial cell [7].
Aliquots of 0.5 mL of the mycelial suspension were resuspended in 0.85% NaCl and adjusted to OD590 0.100 ± 0.098. Aliquots of 150 µL were inoculated into each well of GN2 microtitre plates. The plates were incubated at room temperature and utilisation of the sole compounds was measured spectrophotometrically by recording the colour change of the redox dye tetrazolium at 590 nm, using a computer-integrated microtitre plate reader (Digiscan, Asys, Linz, Austria; software: Digiwin), directly afterinoculation and after 4, 18, 24, 36, 48, 60, 72, 96, 120, 144, 168, 192, 216, 240 and 264 h of incubation.
CALCULATION AND STATISTICAL ANALYSES
In analysis of carbon source utilisation, no adjustment was made for negative values. The measured values from carbon utilisation can be separated into different hierarchical levels. Here, utilisation of the whole panel, utilisation of groups of compounds and utilisation of single C sources was examined as previously described by [8]. The average well colour development (AWCD, expressing the sum of absorbance units of all 96 wells divided by the total number of wells) and the number of positive wells (defined as wells in which mean OD590 nm was twice as high as OD590 nm in the control well) with an absorbance level >0.5 per microtitre plate were calculated. Furthermore, the average well colour development of the total per group of substrates (AWCDG, expressing the sum of absorbance units of individual substrate sets divided by the number of compounds belonging to the substrate group), and the ratios of actual and potentially positive wells belonging to the same substrate group were calculated. All data were analysed for each isolate and reading time by one-way ANOVA (analysis of variance), considering LSD (least significant difference method/Fisher´s LSD) with p<0.05 as significance level (Minitab statistical software, release 15 for Windows, State College, Pennsylvania).
Functional profiles were analysed at three cardinal points: (i) during lag-phase (36 h), (ii) at the end of the exponential phase (96 h) and (iii) at the end of the observation period (264 h), using cluster analysis with single linkages and Euclidean (Minitab statistical software, release 15 for Windows, State College, Pennsylvania) distance and canonical discriminant analysis (SAS, version 9.1, SAS Institute Inc., Cary, NC, USA, licensed by Uppsala University). Canonical discriminant analysis involves a mathematical procedure that reduces data dimensionality by performing a covariance analysis between factors. The first function, canonical function 1 (Can 1), accounts for as much of the variation in the data as possible, and each succeeding function accounts for as much of the remaining variation as possible.
RESULTS
The overall results on AWCD and number of positive wells allowed the five isolates to be divided into two groups, comprising (i) Pythium aphanidermatum (PA) and Fusarium oxysporum f.sp. radicis-lycopersici (FORL) and (ii) Phytophthora cryptogea (PC), P. capsici (PCP) and Fusarium solani (FS) (Fig. 1). Group (i) distinguished itself by a short lag-phase, a rapid exponential phase involving almost all carbon sources offered and a long stationary phase. During the exponential phase, the two isolates differed significantly and FORL terminated its exponential phase 24 h earlier than PA. The three isolates in group (ii) had a slower rate of utilisation of the carbon sources offered, with a more extended lag phase in terms of both AWCD and number of positive wells compared with group (i). These three isolates differed significantly during their exponential phase. The lowest utilisation of carbon sources and number of sources utilised was found for PCP.
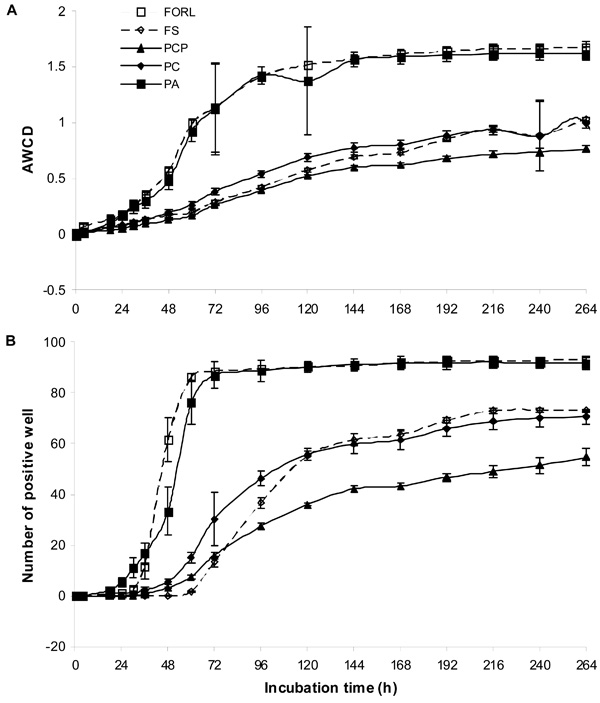
Utilisation of sole carbon sources by pure cultures of Phytophthora cryptogea (PC), Phytophthora capsici (PCP), Pythium aphanidermatum (PA), Fusarium oxysporum f.sp. radicis-lycopersici (FORL) and Fusarium solani (FO) on the basis of (A) average well colour development and (B) number of positive wells.
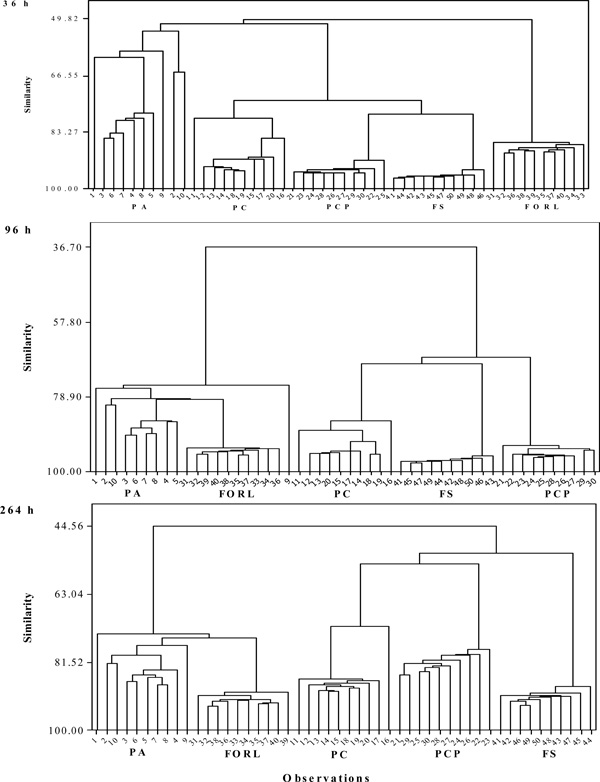
Dendograms obtained by cluster analysis indicating the similarity between the metabolic profiles of pure cultures of Phytophthora cryptogea (PC; observations 11-20), Phytophthora capsici (PCP; observations 21-30), Pythium aphanidermatum (PA; observations 1-10), Fusarium oxysporum f.sp. radicis-lycopersici (FORL; observations 31-40) and Fusarium solani (FO; observations 41-50) after 36, 96 and 264 h of incubation on Biolog GN2 panels.
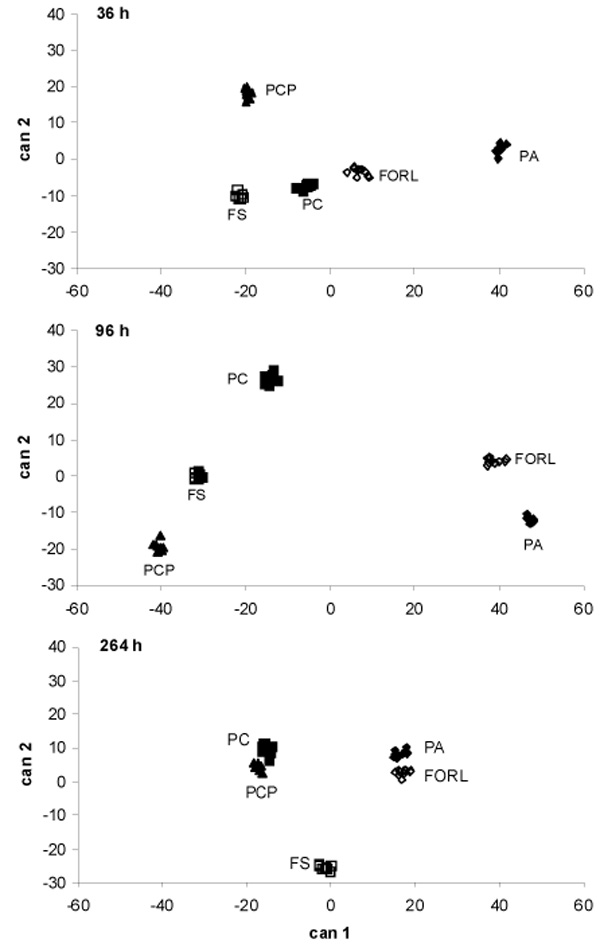
Discriminant analysis of sole carbon source utilisation by pure cultures of Phytophthora cryptogea (PC), Phytophthora capsici (PCP), Pythium aphanidermatum (PA), Fusarium oxysporum f. sp. radicis-lycopersici (FORL) and Fusarium solani (FO) after 36 , 96 and 264 h of incubation on Biolog GN2 panels. Can 1 and can 2= canonical functions 1 and 2.
A similar pattern was found for the set of carbohydrates and for esters, alcohols and phosphorylated compounds. Amino acids accentuated the grouping, still leaving significant differences between the three metabolically less active isolates. This ranking was also supported by the third major group of compounds, aromatic and amino acids, with PCP distinguished by its substantially low utilisation of these compounds. At the end of the observation period only 40% of the compounds offered were used by PC. Table 1 shows the overall results from the compound groups on the basis of AWCDG.
Group-Wise Average Well Colour Development (AWCDG) of Carbon Sources by Three Oomycetes (Pythium aphanidermatum, PA; Phytophthora cryptogea, PC; Phytophthora capsici, PCP) and Two Species of Fusarium (Fusarium oxysporum f.sp. radicis-lycopersici, FORL; Fusarium solani, FS). Overall Values Represent Mean Absorbance Per Group Divided by Number of Carbon (C) Sources Per Group During an Observation Period of 264 h
| Group | Number of C-Sources Per Group | PA | PC | PCP | FORL | FS |
|---|---|---|---|---|---|---|
| Alcohols | 3 | 0.717 a1 | 0.386 b | 0.169 c | 0.568 a | 0.183 d |
| Amides | 3 | 0.99 a1 | 0.538 b | 0.230 c | 0.902 a1 | 0.384 d |
| Amines | 2 | 0.509 a1 | 0.142 b | 0.14 b | 0.557 a1 | 0.381 c |
| Amino acids | 20 | 1.018 a1 | 0.103 d | 0.397 c | 0.968 a1 | 0.477 b |
| Aromatic acids | 2 | 1.32 a1 | 0.775 b | 0.608 c | 1.09 d1 | 0.661 c |
| Brominated compounds | 1 | 0.565a1 | 0.327b | 0.276bc | 0.498d | 0.222c |
| Carbohydrates | 28 | 0.993 a1 | 0.493 bc | 0.378 c | 1.076 a1 | 0.63 b |
| Carboxylic acids | 24 | 0.929 a1 | 0.511 b | 0.424 b | 0.961 a1 | 0.380 b |
| Esters | 4 | 0.856 a1 | 0.366 b | 0.116 c | 0.744 a1 | 0.322 d |
| Phosphorylated compounds | 3 | 0.495 a1 | 0.07 bd | 0.001 b | 0.616 c1 | 0.08 d |
| Polymers | 5 | 1.045a1 | 0.691b | 0.555bc | 0.937a1 | 0.407c |
1 Values within the same row followed by different letters are significantly different according to ANOVA followed by Tukey-family test (p<0.05). n= 10.
When comparing the three most common compound groups, carbohydrates, carboxylic and amino acids, seven compounds showed high extinction values for all fungal isolates tested, namely gentiobiose, α-D-glucose, D-trehalose, α-hydroxy-butyric acid, L glutamic acid, L-proline and L-serine. At an early stage (36 h after incubation) six carbohydrates (gentiobiose, α-D-glucose, maltose, D-raffinose, sucrose, D- trehalose), three carboxylic acids (cis-aconitic acid, D, L-lactic acid, succinic acid) and four amino acids (L-alanyl-glycine, L-aspartic acid, L-glutamic acid, L-proline) had been consumed by all isolates tested. However, gentibiose, α-D-glucose, maltose, sucrose, D-trehalose, L-aspartic acid, L-glutamic acid, L-proline persisted to the end of the exponential phase.
Cluster analyses conducted on data obtained at the three cardinal points during the observation period grouped all five isolates. However, the similarity within PA was weaker than for all other isolates on any of these three occasions. After 36 h the similarity between PA and FORL was low, and these two isolates also deviated strongly from PC, PCP and FS (Fig. 2). At later readings, the similarity between PA and FORL increased substantially.
At all three cardinal points, the five isolates could be distinctly differentiated (Fig. 3). The most distinct groupings were found at the transition from lag to exponential phase (36 h) and from exponential to stationary phase (96 h). After 96 h of incubation, canonical function 1 discriminated between PC, FS, PCP and PA, FORL, which in turn were separated by canonical function 2.
On the basis of discriminant analyses (DA) executed for the three cardinal points, the following compounds separated the isolates: After 36 h: glycogen, i-erythritol, D-melibiose, D-psicose, turanose, citric acid, p-hydroxy phenylacetic acid, α-ketoglutaric acid, quinic acid; after 96 h: i-erythritol, L-fucose, D-psicose, cis-aconitic acid, D-galactonic acid, D-galacturonic acid, α-hydroxybutyric acid, p-hydroxy phenylacetic acid, D, L lactic acid, malonic acid; and after 264 h: N-acetyl-D-galactosamine, D-arabinose, i-erythriol, xylitol, citric acid, D-galacturonic acid, sebacic acid, glucuronamide, L-ornithine, phenylethylamine. The compound i-erythritol overlapped as a decisive compound on all three reading occasions. D-psicose and phenylacetic acid occurred decisively after 36 and 96 h of incubation, whereas citric acid was found decisively both at early and late stages of utilisation. D-galacturonic acid was a decisive compound at the two later cardinal points, 96 h and 144 h.
DISCUSSION
Information on the ecological requirements of root pathogens in closed hydroponic systems is a key factor that could support the development of effective biocontrol strategies in these systems. Analysis of sole carbon source utilisation profiles (SCSUP) provides an indication about the capability of the community to adapt its metabolism [6]. Moreover, evaluation of the metabolic capability of pathogen, antagonist and resident microflora can reveal evidence of any direct competition if these microorganisms show similar affinities to sole carbon sources.
Many investigations using this technique have been performed for characterising complex communities from different environments, but few studies document the functional diversity of fungal communities in general and those of fungal pathogens in particular. However, a specific panel for filamentous fungi has been developed by Biolog Inc. In the present study, we disregarded this type of panel, as we aimed to use the present data for comparison with previous SCSUP from hydroponic greenhouse systems [3-5] and with the biocontrol agents [9]. On the basis of AWCD and positive wells, the root pathogens PA and FORL yielded a greater metabolic response than PC, PCP and FS (Fig. 1). This might indicate their rapid adaptation to the high substrate concentrations in the microplates in the form of fast growth, depleting most of the substrate. The short lag phase (Fig. 1) of these pathogens also indicates efficient utilisation of carbon sources. As regards rhizobacterial communities, previous investigations [10] showed that the populations that develop in Biolog plates are largely fast-growing species adapted to high substrate concentrations. Carbohydrates, carboxylic and amino acids (gentiobiose, α-D-glucose, D-trehalose, α-hydroxybutyric acid, L-glutamic acid, L-proline and L-serine, maltose, D-raffinose, sucrose, D-trehalose, cis-aconitic acid, D, L-lactic acid, succinic acid, L-alanyl-glycine, L-aspartic acid) were carbon sources utilised by all pathogens tested (Table 1). In previous studies, these carbon sources were among those identified as being related to the utilisation pattern of Pythium oligandrum [11], Pythium ultimum [12], Pythium arrhenomanes, Pythium myriotylum and Pythium dissotocum [13]. However, little is known about the SCSUP of the root pathogens belonging to the fungal groups Fusarium and Phytophthora. Some studies have reported that the carbon sources glucose, fructose and sucrose are needed for the growth of Phytophthora capsici [14] and that fructose, mannose and galactose are needed for the growth of Fusarium solani [15]. The results from the present study showed that the pathogens belonging to the fungal groups Fusarium and Phytophthora utilised not only carbohydrates but also alcohols, esters, carboxylic and amino acids (Table 1).
Furthermore, SCSUP of the resident microflora [3, 4] has indicated higher utilisation of carbohydrates and amino acids by the microbial communities on young and old roots respectively. Substantial use of amino acids has also been found for Trichoderma spp., Gliocladium sp. and Streptomyces griseoviridis in commercial biocontrol products [9]. Similarities in the SCSUP between the pathogens, resident microflora and biocontrol agents might indicate direct competition between these strains for carbon sources. This would thereby leads to difficulties in discriminating the metabolic profiles of the pathogens from those of the resident microflora or the introduced biocontrol agents as it was expected in our purpose of the study. Furthermore, both cluster and discriminate analysis (Figs. 2 and 3) separated the root pathogens PA and FORL compared with PC, PCP and FS, indicating differences in carbon source utilisation ability between the fungal pathogens PA and FORL compared to PC, PCP and FS. Furthermore, the results might also indicate similarities in the metabolic activity between PA and FORL. Discrimination between different pathogens during an early growth stage might also provide the potential for using SCSUP-based data for the development of early warning systems in closed hydroponics.
ACKNOWLEDGEMENTS
This work was carried out with financial support from the Swedish Farmers’ Foundation for Agricultural Research (SLF) and the Swedish Research Council for Environment, Agricultural Science and Spatial Planning (FORMAS) which are gratefully acknowledged.